Annenberg Foundation
Annenberg Learner: Drawing a Box Plot
Learn how to represent the Five-Number Summary graphically using a box plot.
Quia
Ixl Learning: Box and Whisker Plots
Brush up on your math skills relating to box and whisker plots then try some practice problems to test your understanding.
Quia
Ixl Learning: Interquartile Range
Brush up on your math skills relating to interquartile range then try some practice problems to test your understanding.
Shodor Education Foundation
Shodor Interactivate: Lesson: Stem and Leaf Plots
Lesson plan introduces young scholars to stem-and-leaf plots. Many resources are available for student and teachers here.
Other
Nmu: Box and Whisker Plot Instructions
Site discusses the use of box-and-whisker plots. An example is presented and completely worked through, so that the user can see the results of the calculations after the steps have been explained.
Other
College of Natural Sciences: Measures of Location
Different measures of location are discussed in terms of box and whisker plots.
McGraw Hill
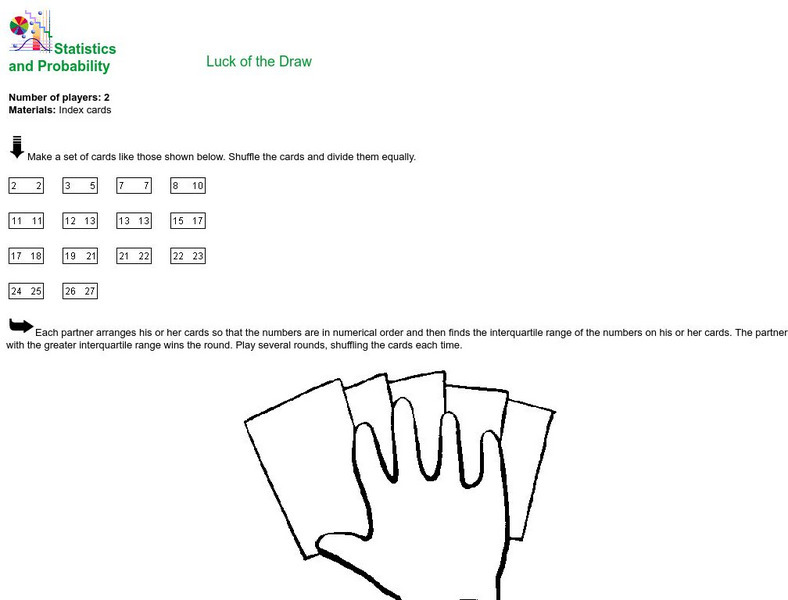
Mc Graw Hill Education: Glencoe: Statistics and Probability: Luck of the Draw
Instructions for creating and playing a simple card game through which students can practice calculating the interquartile range from a set of numbers.
United Nations
Unesco: Measures of Dispersion
Explanation of the different measures of dispersion (range, interquartile range, and standard deviation) are given.
BBC
Bbc: Statistical Skills: Comparing Data Sets Using Statistics
This site is a demonstration of Comparing data sets using statistics and forming a linear model from a given set of data. Examples and a practice test are included.
Calculator Soup
Calculator Soup: Quartile Calculator
This quartile calculator and interquartile range calculator finds first quartile Q1, second quartile Q2 and third quartile Q3 of a data set. It also finds median, minimum, maximum, and interquartile range.


