Other
Water on the Web
Water on the Web (WOW) is an advanced site allowing students to actively participate in data analysis from real research sites. Lesson plans on a range of topics are provided. There is also a tutorial for using Excel to graph WOW data.
Cuemath
Cuemath: Outlier
A comprehensive guide for exploring the topic of outliers with definitions, what is an outlier, how to find outliers using the turkey method and the interquartile range, solved examples, and interactive questions.
Scholastic
Scholastic: Cultivating Data
Students will understand key concepts of data analysis and their graphic representations. Students will construct and interpret data tables, line plots, box-and-whisker plots and stem-and-leaf plots, scatterplots with line of best fit,...
Shodor Education Foundation
Shodor Interactivate: Outliers
Explore what outliers are with this interactive activity.
Texas Instruments
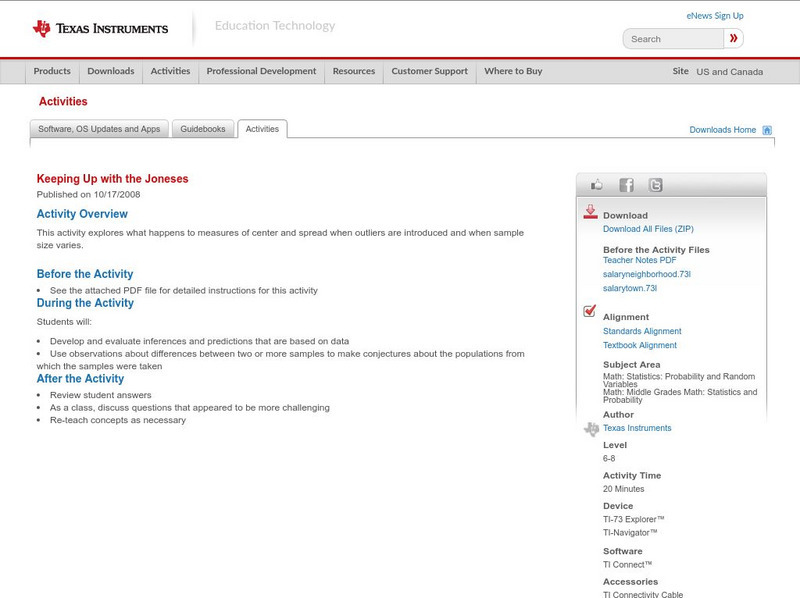
Texas Instruments: Keeping Up With the Joneses
This activity explores what happens to measures of center and spread when outliers are introduced and when sample size varies.
Texas Instruments
Texas Instruments: Numb3 Rs: "Take Out" Outliers
Based off of the hit television show NUMB3RS, this lesson has students create box-and-whisker plots for given data, and then determine which (if any) data points are outliers. Students determine outliers through two methods in this...
Other
Stat Soft: Statistics Glossary
Dozens of statistical terms are defined and illustrated in this glossary.
Mangahigh
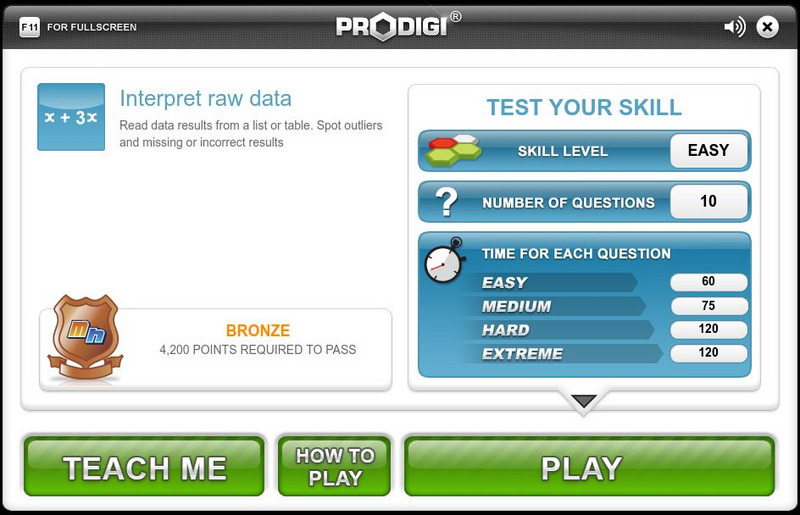
Mangahigh: Data: Interpret Raw Data
Students learn about the concept of interpreting raw data and finding outliers by exploring a tutorial. They can then test their knowledge by taking a ten question assessment that increases in difficulty as they correctly answer questions.
CK-12 Foundation
Ck 12: Statistics: Applications of Box and Whisker Plots Grade 8
[Free Registration/Login may be required to access all resource tools.] Using box-and-whisker plots to understand and interpret data.
CK-12 Foundation
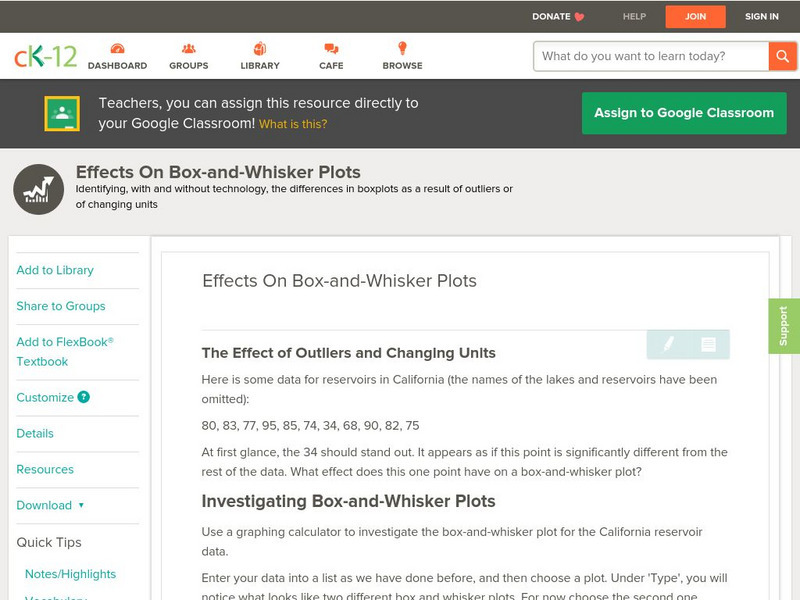
Ck 12: Statistics: Effects on Box and Whisker Plots
[Free Registration/Login may be required to access all resource tools.] This Concept covers the effects of outliers and a change in units on box-and-whisker plots.
Khan Academy
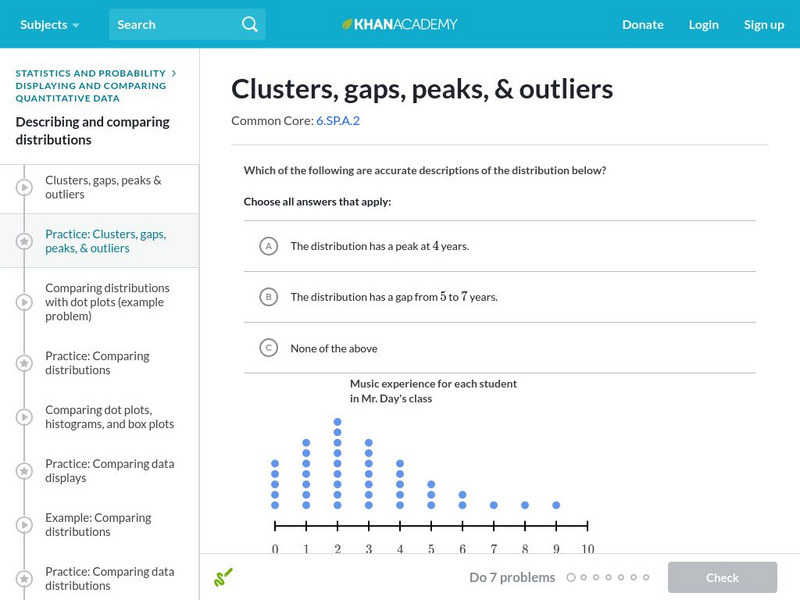
Khan Academy: Clusters, Gaps, Peaks, and Outliers
In this exercise, students practice describing data distributions as clusters, gaps, peaks, and outliers. Students receive immediate feedback and have the opportunity to get hints and try questions repeatedly.
CK-12 Foundation
Ck 12: Statistics: Box and Whisker Plots Grades 9 10
[Free Registration/Login may be required to access all resource tools.] Make and interpret a box-and-whisker plot for a set of data.
Varsity Tutors
Varsity Tutors: Hotmath: Practice Problems: Statistics
Fifteen problems presented on the topics: mean, median, mode, outliers and graphing statistics. They are given with each step to the solution cleverly revealed one at a time. You can work each step of the problem then click the "View...
Sophia Learning
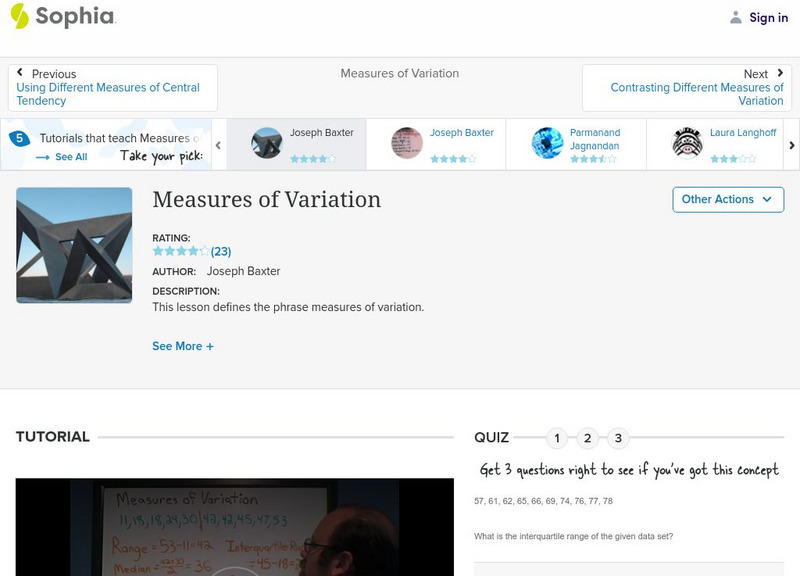
Sophia: Measure of Variation
Explore the measures of variation and check understanding with an assessment.
University of Baltimore
University of Baltimore: Statistical Data Analysis: Outlier Removal
Outliers are data items which lie very far below or very far above the "majority" of the data in a set. Here you will find the steps to take to correctly identify whether a data set has outliers as well as how to remove them. Written by...
Other
Stat Trek: Data Patterns in Statistics
This lesson looks at how to recognize patterns in a data display by examining the shape of a graph, the center, the spread, and unusual features such as outliers. Includes video. [11:16]
Illustrative Mathematics
Illustrative Mathematics: S Id.3 Describing Data Sets With Outliers
For certain data sets, such as home prices and household or individual income, is often described using the median instead of the mean. This lesson explores the mean and median in some different situations to help you understand the...
Illustrative Mathematics
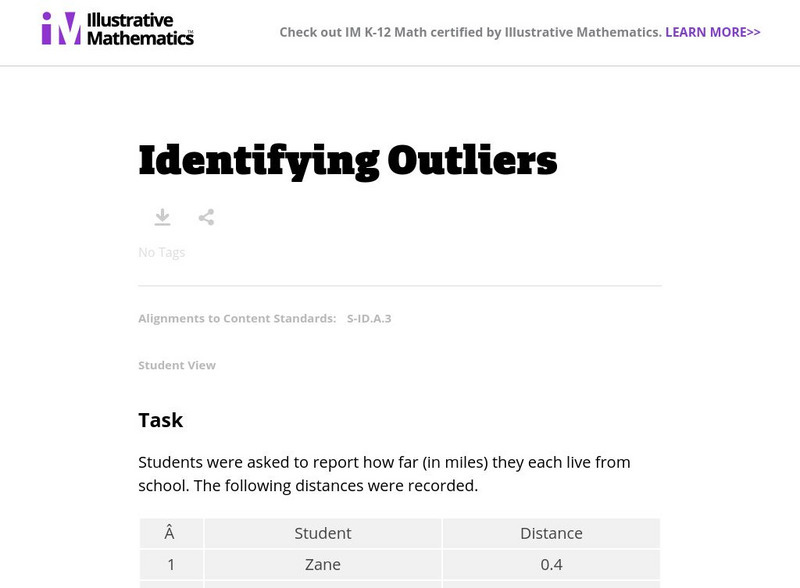
Illustrative Mathematics: S id.a.3 Identifying Outliers
In this task, students are asked to construct a box plot of the distances they live from school and describe the main features of the distribution. The purpose of this task is to develop students' understanding of how extreme data points...
Illustrative Mathematics
Illustrative Mathematics: 8.sp Animal Brains
This task looks at a possible relationship between the weight of an animal's body and the weight of its brain. Students make a scatter plot of data, look for outliers, make a second scatter plot without the outliers, and describe the...
CK-12 Foundation
Ck 12: Statistics: Least Squares Regression
[Free Registration/Login may be required to access all resource tools.] This Concept introduces students to least-squares regression.
CK-12 Foundation
Ck 12: Algebra: Fitting Lines to Data
[Free Registration/Login may be required to access all resource tools.] Learn how to write equations of best fit lines.
Alabama Learning Exchange
Alex: Count Your Raisins
In this activity learners will create a class line plot using data collected from boxes of raisins. This activity will be used to collect, organize, represent, and describe data using the line plot.
Shodor Education Foundation
Shodor Interactivate: Box Plot
Students can create box plots for either built-in or user-specified data as well as experiment with outliers. User may choose to use or not use the median for calculation of interquartile range.


