That Quiz
That Quiz: Practice Test: Graphs
This resource allows users to test their knowledge of graphs and graphing methods.
National Council of Teachers of Mathematics
The Math Forum: Chameleon Graphing: Coordinate Plane
Dive into this introduction to graphing in the coordinate plane, and meet a chameleon named Sam. Sam will help guide you through graphing points on a line, using negative numbers, and graphing points in the coordinate plane.
Texas Education Agency
Texas Gateway: Analyze Graphical Sources: Practice 2 (English I Reading)
This lesson focuses on practice exercises to understand and interpret the data in a graphic representations including pie charts, bar graphs, and line graphs.
Scholastic
Scholastic: Bars, Lines, and Pies
Young scholars will learn and reinforce skills for creating, applying and analyzing pie charts, bar graphs and line graphs.
University of Illinois
University of Illinois: Line Graphs
Line graphs are shown and explained here. You can learn what kind of data is best represented using a line graph. There are also line graphs with questions and answers available to help you learn how to read them.
The Franklin Institute
Frankin Institute Online: Group Graphing
This site from The Franklin Institute explores how to make a simple graph using a spreadsheet to portray survey data. It also gives a set of interesting sports-related web sites so that students can get statistical inforamtion.
Mangahigh
Mangahigh: Data: Using Line Graphs
This site provides students practice with the concept of line graphs. Students can learn about the topic by completing an interactive tutorial. Students can then take a ten question timed test to practice the skill.
CK-12 Foundation
Ck 12: Statistics: Broken Line Graphs
[Free Registration/Login may be required to access all resource tools.] Covers creating and interpreting broken-line graphs.
CK-12 Foundation
Ck 12: Statistics: Line Graphs Grades 9 10
[Free Registration/Login may be required to access all resource tools.] Make a line graph to display data over time.
CK-12 Foundation
Ck 12: Statistics: Line Graphs Grade 7
[Free Registration/Login may be required to access all resource tools.] Make a line graph to display data over time.
CK-12 Foundation
Ck 12: Statistics: Line Graphs to Display Data Over Time
[Free Registration/Login may be required to access all resource tools.] Create line graphs to display how data changes over time.
National Center for Ecological Analysis and Synthesis, University of California Santa Barbara
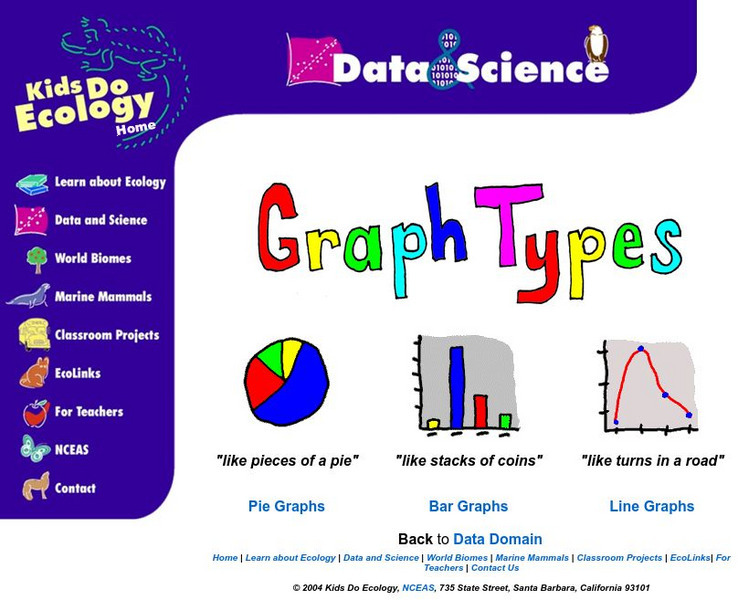
Nceas: Graph Types
At this site from NCEAS you can learn how to organize your data into pie graphs, bar graphs, and line graphs. Explanations and examples are given of each graph along with several questions that check comprehension.
Texas Education Agency
Texas Gateway: Analyze Graphical Sources: Practice 2 (English I Reading)
You will look at each of these types of graphs: bar graph, line graph, pie charts, as you work your way through the lesson.
BBC
Bbc: Representing Data
This BBC Math Bite tutorial for line graphs, pictograms, and frequency polygons features an exam in which students draw and interpret statistical diagrams.
Alabama Learning Exchange
Alex: "Ridin' Along in My Automobile"
Students will research prices of used cars to discover how automobiles lose their value over time. Students will create a chart to record their information, use their chart to graph their data, and find measures of central tendency of...
Better Lesson
Better Lesson: Line Me Up. Analyzing and Creating Line Graphs
Line graphs are used in our daily lives to show change over time.
Cuemath
Cuemath: Data Handling
This comprehensive guide about data handling helps with understanding how the study of data handling and graphical representation of the data along with other tools help us in dealing with numerical data. Includes solved examples and...
PBS
Pbs: Interpreting Stories and Graphs
This interactive exercise focuses on how line graphs can be used to represent mathematical data and provides an opportunity to translate actions from a story into graph form, then to write your own story to coincide with a line graph.
PBS
Pbs Learning Media: Graphs, Charts, and Tables: Targeted Math Instruction
At the end of this lesson about graphs, charts, and tables, students will be able to interpret and compare data from graphs (including circle, bar, and line graphs), charts, and tables.
University of Illinois
University of Illinois: Earthquakes of the World
Resource contains a lesson plan that utilizes data from earthquakes. Students are instructed to analyze and interpret line graphs that display the earthquake data.
Primary Resources
Primary Resources: Line Graphs and Pie Charts
Here are a few resources to use with your students when teaching about line graphs or pie charts.
The Math League
The Math League: Using Data and Statistics
This site contains two short examples of line graphs, charts that show change over time. This is a quick introduction to the topic of statistical graphing.
ClassFlow
Class Flow: Using Graphs in History Class
[Free Registration/Login Required] This flipchart covers the major types of graphs used in social studies such as bar graphs, line graphs, pie graphs, and pictographs. Information on graphs is followed by graphs dealing with salaries...


