Curated OER
Mean, Median, Mode, and Range: Practice
In this line plots instructional activity, students make a line plot for each set of data and identify any clusters or gaps. Students then find the mean, median, mode, and range for the first four problems. Students then find n using the...
Math Drills
Math Drills: Statistics and Probability Worksheets
Download these free worksheets to sharpen your skills with statistics and probability. Sheets focus on collecting and organizing data, measures of central tendency (mean, median, mode, and range), and probability.
Scholastic
Scholastic: Cultivating Data
Students will understand key concepts of data analysis and their graphic representations. Students will construct and interpret data tables, line plots, box-and-whisker plots and stem-and-leaf plots, scatterplots with line of best fit,...
Other
Mr maffesoli.com: Line Plot Worksheet a [Pdf]
Fifth graders will practice answering questions on this worksheet based on the given line plot.
Other
Mr maffesoli.com: Line Plot Worksheet B [Pdf]
Fifth graders will be given line plots about gummy candies and other topics that they will use to answer questions.
Other
Mr maffesoli.com: Line Plot Worksheet C [Pdf]
Fifth graders will complete questions on a worksheet about line plots and will also create a line plot from given information.
Mangahigh
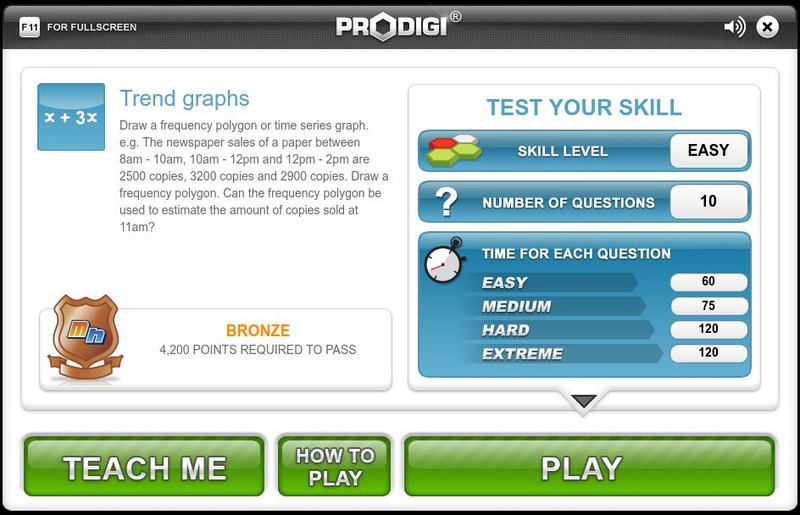
Mangahigh: Data: Trend Graphs
Students explore the concept of frequency trend graphs by working through an online tutorial and then attempting a ten question quiz that increases in difficulty as questions are answered correctly.
CK-12 Foundation
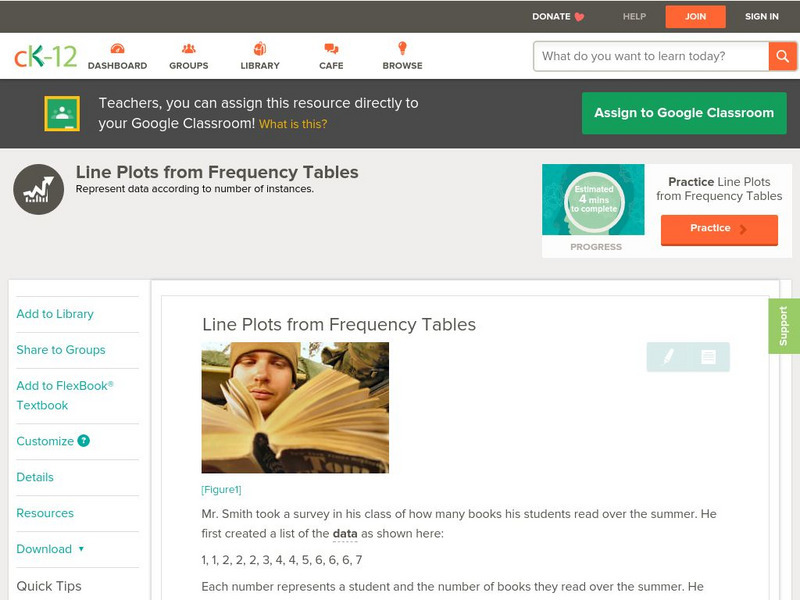
Ck 12: Statistics: Line Plots From Frequency Tables
[Free Registration/Login may be required to access all resource tools.] Create a line plot given data organized in a frequency table.
Math Planet
Math Planet: Stem and Leaf Plots and Box and Whiskers Plot
Discover how to use stem-and-leaf plots and box-and-whisker plots to visualize data by taking a look at examples and a video lesson.
Khan Academy
Khan Academy: Make Line Plots
Practice creating line plots (dot plots) from data sets. Students receive immediate feedback and have the opportunity to try questions repeatedly, watch a tutorial video, or receive hints.
Khan Academy
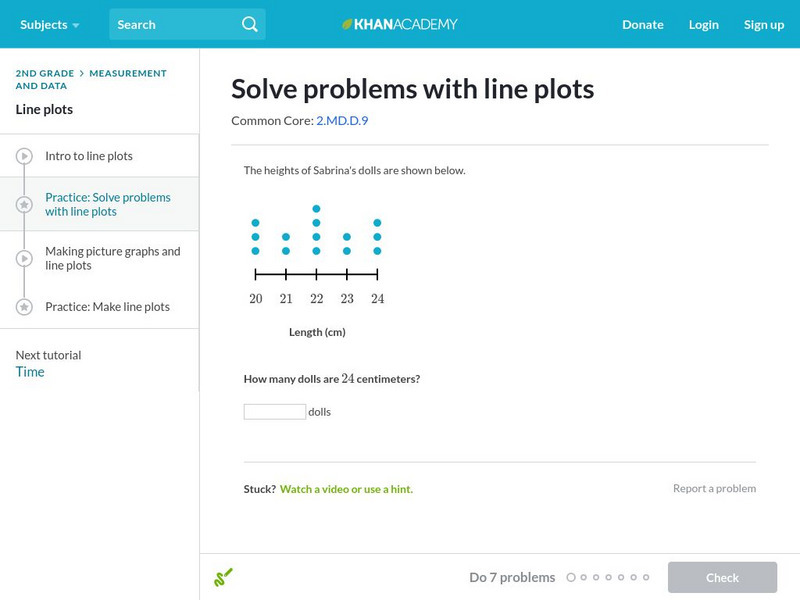
Khan Academy: Solve Problems With Line Plots
Answer questions using line plots and data sets. Students receive immediate feedback and have the opportunity to try questions repeatedly, watch a tutorial video, or receive hints.
Khan Academy
Khan Academy: Read Line Plots (Data With Fractions)
Practice reading and interpreting data that is graphed on line plots. The data graphed includes fractions. Students receive immediate feedback and have the opportunity to try questions repeatedly, watch a video or receive hints....
CK-12 Foundation
Ck 12: Statistics: Displaying Bivariate Data
[Free Registration/Login may be required to access all resource tools.] This Concept shows students how to display bivariate data using scatter plots and line plots.
Better Lesson
Better Lesson: Graphing Our Snack Mix: Review of Graphing
Second graders review how to make bar graphs, line plots, and pictographs by tallying the contents of snack mix and building graphs to show their data.
Other
Northern Michigan University: Line Plots
The author utilizes a line plot to demonstrate what an "outlier" is, what "clusters" are, and what "gaps" are.
Varsity Tutors
Varsity Tutors: Hotmath: Algebra Review: Line Plot
Find a quick, concise explanation of a line plot. An example is given and clearly explained.
Math Aids
Math Aids: Graph Worksheets
Great resource to practice and strengthen math skills pertaining to graphs. Math worksheets are printable, may be customized, and include answer keys.


![Mr maffesoli.com: Line Plot Worksheet a [Pdf] Unknown Type Mr maffesoli.com: Line Plot Worksheet a [Pdf] Unknown Type](https://content.lessonplanet.com/knovation/original/120986-a0bfa0f663f5c112fec7f4971f949fd6.jpg?1661814821)
![Mr maffesoli.com: Line Plot Worksheet B [Pdf] Unknown Type Mr maffesoli.com: Line Plot Worksheet B [Pdf] Unknown Type](https://content.lessonplanet.com/knovation/original/120987-067626dba651be86d90a643ffb74f433.jpg?1661814822)
![Mr maffesoli.com: Line Plot Worksheet C [Pdf] Unknown Type Mr maffesoli.com: Line Plot Worksheet C [Pdf] Unknown Type](https://content.lessonplanet.com/knovation/original/120988-88ef11e71923fcc1040b64867e5e0c68.jpg?1661814823)


