University of South Florida
Fcat: Shaq's Hand/foot Span: Teacher Notes
Students compare their own hand/foot span to Shaquille O'Neal's, then graph the data & construct a best-fit line. They can then use the information to investigate the proportionality of the human body.
University of South Florida
Fcat: View Tubes: Teacher Notes
For this online activity use view tubes to collect data and determine the linear relationship and line of best fit.
TeachEngineering
Teach Engineering: Linear Regression of Bmd Scanners
Students complete an exercise showing logarithmic relationships and examine how to find the linear regression of data that does not seem linear upon initial examination. They relate number of BMD scanners to time.
TeachEngineering
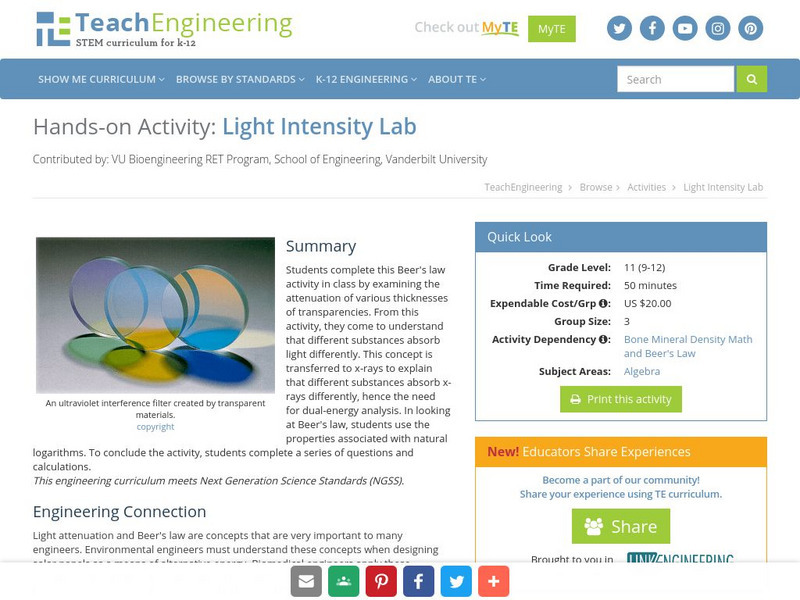
Teach Engineering: Light Intensity Lab
Students complete this Beer's Law activity in class. Students examine the attenuation of various thicknesses of transparencies. From this activity, students will understand that different substances absorb light differently. This can...
TeachEngineering
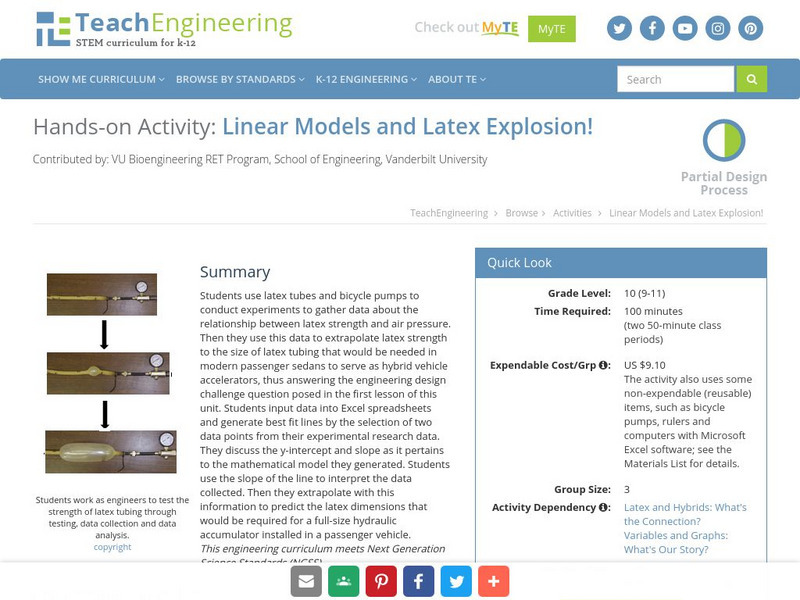
Teach Engineering: Linear Models and Latex Explosion!
Students use latex tubes and bicycle pumps to conduct experiments to gather data about the relationship between latex strength and air pressure.
TeachEngineering
Teach Engineering: Latex Tubing and Hybrid Vehicles
This unit gives students the opportunity to make use of linear models in order to make predictions based on real-world data. Students experience how engineers address incredible and important design challenges through the use of linear...
University of Colorado
University of Colorado: Ph Et Interactive Simulations: Least Squares Regression
Create your own scatter plot or use real-world data and try to fit a line to it. Explore how individual data points affect the correlation coefficient and best-fit line.
Oswego City School District
Regents Exam Prep Center: Regression Analysis
A collection of lesson ideas, a practice activity, and teacher resources for exploring regression analysis.
Texas Education Agency
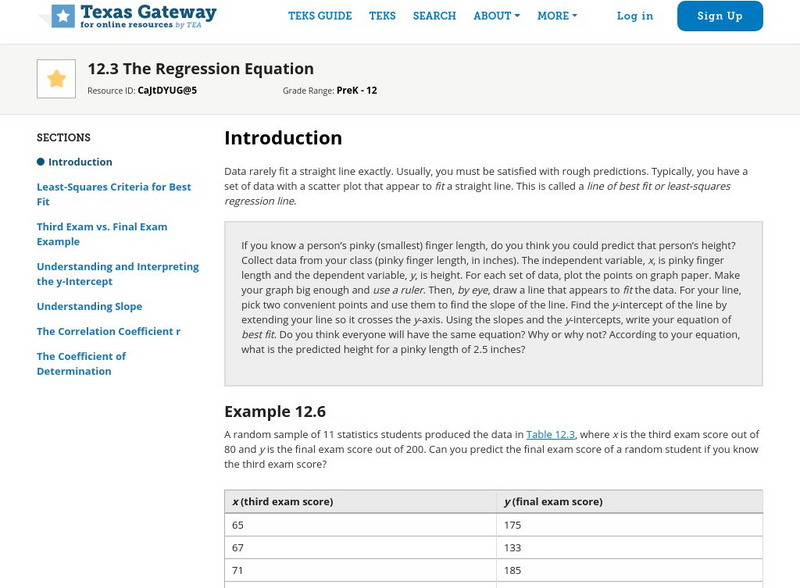
Texas Gateway: Tea Statistics: The Regression Equation
A tutorial on how to find the line of best fit or least-squares regression line for a set of data in a scatter plot using different methods and calculations.
Duke University
Duke University: Introduction to Linear Regression
This page discusses linear regression, its equations, background, and applications. Provides questions, answers, formulas, and explanations for understanding.
Richland Community College
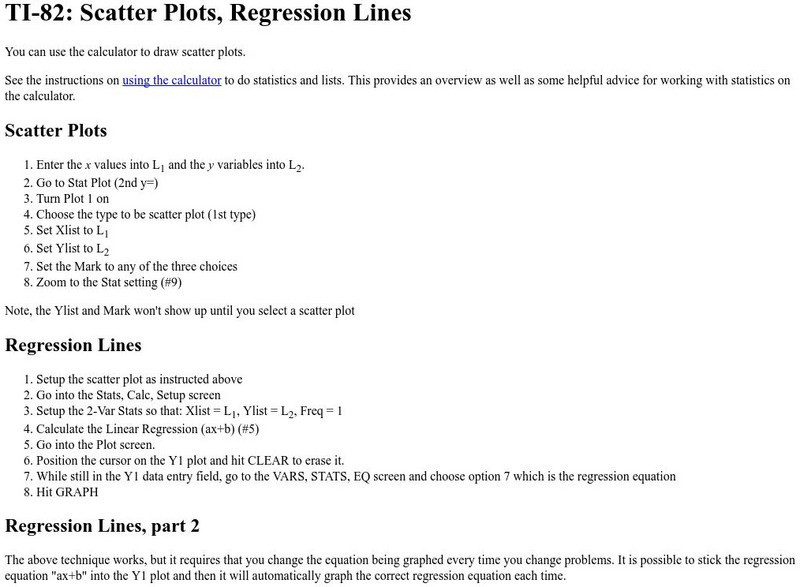
Richland Community: Ti 82 Manual for Scatter Plots
This website from the Richland Community College is useful for owners who have the TI-82 and need to know how to set up the scatter plot. Step by step procedure helps for easy set-up.
Texas Instruments
Texas Instruments: To the Moon
Students can use linear regression to generate the formula for circumference.
Texas Instruments
Texas Instruments: Approximation of Pi
Students will measure the circumference and diameter of a variety of different circles. They will graph the class' values of (d,c) on the coordinate plane and use linear regression to approximate pi.
Texas Instruments
Texas Instruments: Investigate Outliers Effect on Regression Lines
In this activity, students begin to investigate linear regression by looking at the effect of outliers on the regression line. The worksheet is interactive.
Texas Instruments
Texas Instruments: Cricket Thermometers
In this activity, students investigate the relationship between temperature and number of cricket chirps. They learn to find the other value of a function when given one value of a function. Students use linear regression and plot a set...
Texas Instruments
Texas Instruments: Getting Started With the Ti Navigator: Exploring Change
This activity introduces students to Activity Center. In this activity, students will explore change in the context of cellular telephone charges. Students will create a scatter plot showing that the rate per minute for a "pay as you go"...
Texas Instruments
Texas Instruments: What Is Linear Regression?
In this activity, students will explore finding the line of best fit based on the sum of the squares of the residuals and determine what the linear regression line is.
Texas Instruments
Texas Instruments: Do You Have a Temperature?
In this activity, students represent and analyze climate data. They use linear regressions to understand the relationship between temperatures measured in the Fahrenheit and Celsius scales and examine conversion factors.
Texas Instruments
Texas Instruments: Ball Bounce
This activity allows students to use real data obtained by them to model quadratic equations. students can use the TI-83 and/or TI-84 and a motion detector to collect their data. The students will then manually fit both quadratic and...
Texas Instruments
Texas Instruments: Canadian Life Expectancy
In this activity, students analyze statistical data Using the calculator and the TI-InterActive! software. They perform regression on the data to find the life expectancy of people in Canada.
Texas Instruments
Texas Instruments: What Is a Linear Regression?
In this activity, students create lists of data points, plot them on a graph, and determine the regression equation of the best fitting line. They also understand exactly how the linear regression is determined.
Texas Instruments
Texas Instruments: Exponential Models and Logarithmic Scales
In this activity, students will analyze exponential growth data and then switch to a logarithmic scale. Includes both an exponential and a linear regression on the data, and asks students to make connections between two forms of...
Texas Instruments
Texas Instruments: Key Curriculum Press Precalculus: Intro to Linear Regression
Students will find the sum of the squares of the residuals for a function found by linear regression.
Texas Instruments
Texas Instruments: Exploring Circles
Explore the relationship between the center and radius of a circle and the equation of the circle. Collect data and determine regression equations related to various combinations of data, and use the regression equations to make...


