Texas Instruments
Texas Instruments: Numb3 Rs: Less Is More
Based off of the hit television show NUMB3RS, this two-part lesson begins by having students try to find the line of best fit for a given set of data (strike outs vs. home runs). The second part of the lesson shows how least squares...
Texas Instruments
Texas Instruments: Run Me a Linear Regression
This activity is designed to give students the opportunity to estimate the least squares line given a set of points. The students are then able to check their "best fit" line by running a linear regression using the graphing calculator.
Texas Instruments
Texas Instruments: Muddy Footprints Adventure 11
In this adventure, students will analyze the relationship between height and stride length, and then use that information to identify the biker who left the footprints. They create a scatter plot, find the linear regression equation for...
Texas Instruments
Texas Instruments: Shoe Size vs Height
Students will be sent empty lists and need to send back their shoe size and height in inches. TI-Navigator will compile all lists and send compiled list to students. Students will then use the compiled list to make scatterplot and find...
Texas Instruments
Texas Instruments: Greenhouse Gas Emissions
In this activity, students analyze statistical data using the calculator and the TI InterActive! software. They use linear regression to study the increase in levels of carbon dioxide emission over the years.
Texas Instruments
Texas Instruments: Burning Volumes
An analysis of how the volume of various jars impacts the burning time of candles. Data collected will be used to explore modeling, line fitting and linear regression Using graphing calculators.
Texas Instruments
Texas Instruments: Women's 5000 M World Record Progression: Median Median Line
In this activity, students will collect the Women's 5000 meter progression of world record data and find the median - median line and the linear regression for the data. They will investigate the appropriateness of each of the models.
Texas Instruments
Texas Instruments: Finding Linear Models
Students graph a scatter plot, find average rate of change, develop a linear model, find a linear regression and a median/median line for a set of data graphed in a scatter plot and predict profit.
Texas Instruments
Texas Instruments: Learning to Do Linear Regressions
This activity compares children's age to height to teach linear regressions. The handout includes notes for students and teachers with a step-by-step lesson on how to do three types of linear regressions - Best Fit line, Median Line and...
Texas Instruments
Texas Instruments: An Exploration of Direct Variation and Linear Regression
Students will use this activity for the following Algebra concepts: Review of Direct Variation; Properties of direct variations; Finding the constant of variations from data sets; Find missing values in data sets both numerically and...
Texas Instruments
Texas Instruments: Da Vinci's Proportions
This activity is designed to help students work with linear regression models, error, correlation coefficients and coefficients of determination. In this activity students not only deal with the mathematical concepts of regression but...
Texas Instruments
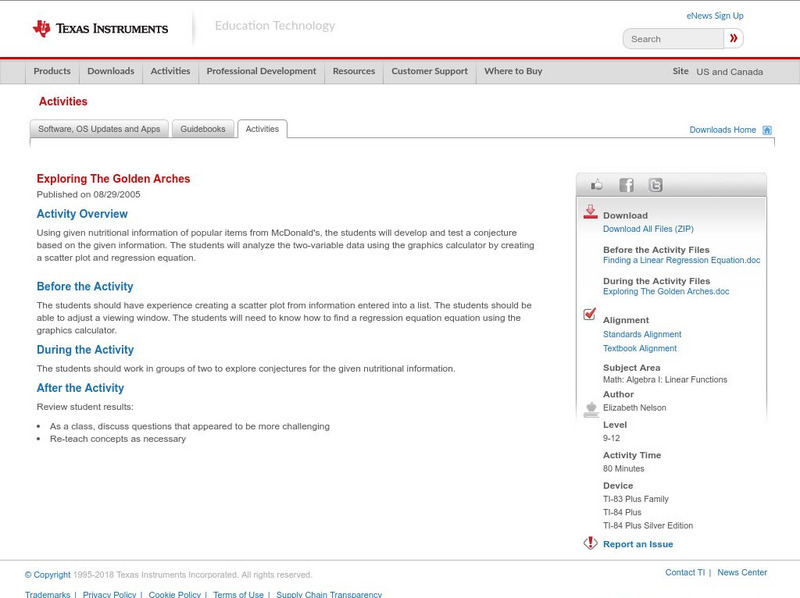
Texas Instruments: Exploring the Golden Arches
Using given nutritional information of popular items from McDonald's, the students will develop and test a conjecture based on the given information. The students will analyze the two-variable data using the graphics calculator by...
Stefan Warner and Steven R. Costenoble
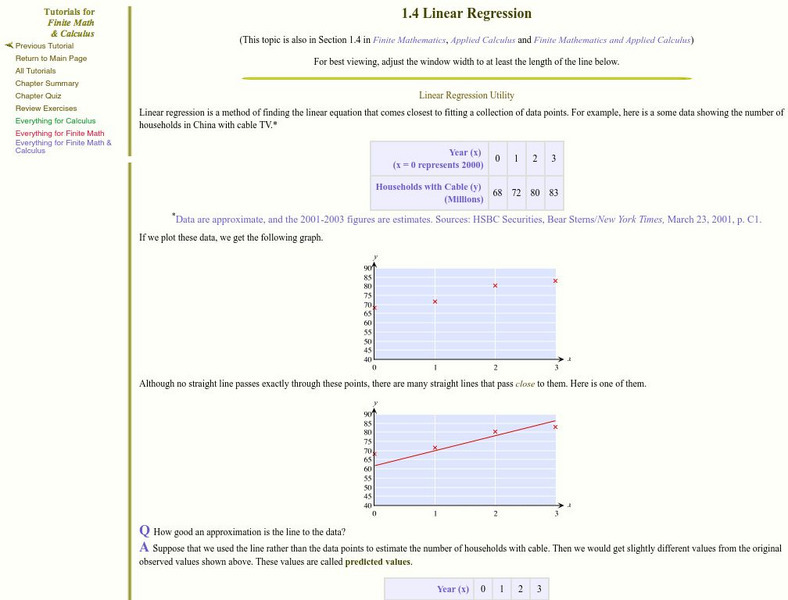
Finite Mathematics & Applied Calculus: Linear Regression
A math tutorial on linear regression, which also focuses on predicted value, residues, and sum-of-squares error.
Stefan Warner and Steven R. Costenoble
Finite Mathematics & Applied Calculus: Linear Regression
The tutorial explores linear regression. Students learn about the concept through class notes, examples, and practice problems. Review exercises and a chapter quiz are included.
Stefan Warner and Steven R. Costenoble
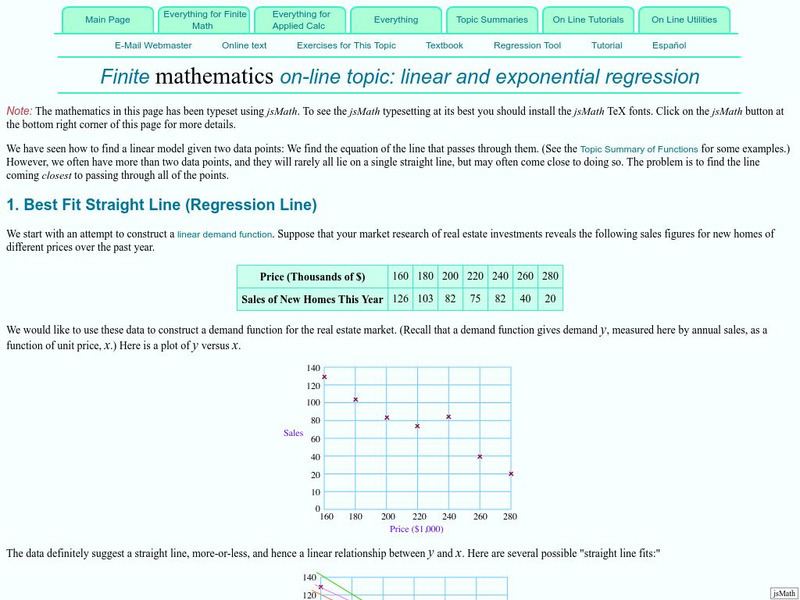
Finite Mathematics & Applied Calculus: Linear and Exponential Regression
Students learn about linear and exponential regression. Class notes, examples, and practice problems are used to investigate the concepts.
California State University
Cal State San Bernardino: Linear Regression
Cal State San Bernardino offers an excellent site on linear regression, including formulas and an applet that allows you to mark the locations of ordered pairs and then determines the equation of the regression line and graphs it.
Other
Clayton State: Linear Regression
Introductory look at linear regression. Notes presented in outline form, with key concepts and formulas given. An example is presented at the end.
Other
Linear Functions, Slope and Regressions
Find activities here for linear functions, slopes and regression lines. Use them for classroom work or individual assignments.
Other
Graph pad.com: Comparing Linear Regression to Nonlinear Regression
This resource presents a complete and detailed look at linear regression. This guide provides lots of details and graphs to explain each concept.
National Council of Teachers of Mathematics
Nctm: Illuminations: Linear Regression 1
An interactive program where students will explore regression lines. Students will be introduced to the correlation coefficient and come to understand what it represents through the given exploration. Requires Java.
CK-12 Foundation
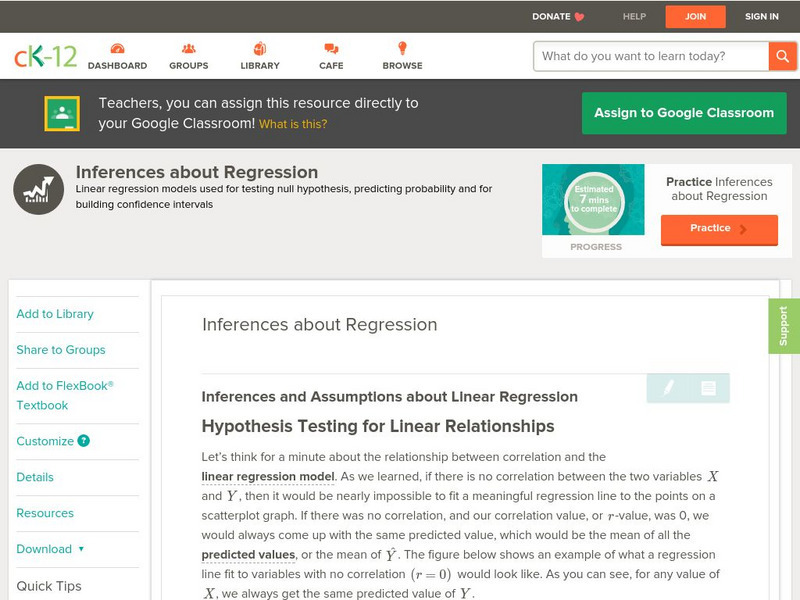
Ck 12: Statistics: Inferences About Regression
[Free Registration/Login may be required to access all resource tools.] This Concept introduces students to testing a claim about linear regression.
Other
Graph Pad: Data Analysis Resource Center
The GraphPad Statistics Guide is both a guide to doing statistical analyses with GraphPad Prism 7, and a concise review of statistical principles, emphasizing clear explanations with very little math. The GraphPad Curve Fitting Guide is...
National Council of Teachers of Mathematics
Nctm: Illuminations: Line of Best Fit
Use this applet to learn about a line of best fit for a set of data points. Some example data in this site include statistics from the 2004-2005 LA Lakers season. Students can guess the equation for a set of data points before the applet...
Texas Instruments
Texas Instruments: Identifying Types of Correlation From a Graph and Calculator
Students will identify different types of correlations graphically and by using the linear regression analysis obtained from a TI-84 Plus calculator. Students will also obtain and know the significance of a correlation coefficient as a...


