Curated OER
Population Ecology
A complete study of population ecology is covered by this worksheet. Biology or ecology learners answer questions and interpret population graphs. This can be used as the intended guided notes worksheet or assigned as homework.
US Department of Commerce
Community Change
America is a country on the move. Analyzing data from the Census Bureau, class members gauge the people moving in and out of their areas. An interactive web feature allows pupils to see who is moving out and moving in, while discussion...
National Wildlife Federation
Controversy Over Wild Cats
Everyone should take an interest in the fate of wild cats. A thorough instructional activity explores the habitat changes of native North American wild cats and asks learners to make connections to human development. They consider the...
College Board
2016 AP® Statistics Free-Response Questions
Test your classes on their knowledge of advanced statistic concepts. Young math scholars get a sneak peek at the end of course AP® statistics exam with the released items from the 2016 test. The six-question free response exam addresses...
College Board
2017 AP® Statistics Free-Response Questions
Reduce testing anxiety by helping learners prepare for test day. Scholars complete six free-response questions from a released AP® exam. The questions test a variety of concepts including confidence intervals, frequency tables,...
College Board
Sampling Distributions
The validity of data depends on the strength of the sample. A collection of instruction and activities focuses on sampling distributions and the analysis of that data. Scholars learn about distribution tests such and Central Limit...
College Board
2017 AP® Human Geography Free-Response Questions
How have urban planners tried to attract people to cities? What can be done about booming birth rates in some parts of the world? How does a country's political structure affect the well being of its people? Scholars investigate these...
Concord Consortium
Center of Population
Let the resource take center stage in a lesson on population density. Scholars use provided historical data on the center of the US population to see how it shifted over time. They plot the data on a spreadsheet to look the speed of its...
Mathematics Vision Project
Module 9: Modeling Data
How many different ways can you model data? Scholars learn several in the final module in a series of nine. Learners model data with dot plots, box plots, histograms, and scatter plots. They also analyze the data based on the data...
101 Questions
Money Duck
A video presentation shows duck-shaped soap that has a $1, $5, $10, $20, or $50 bill in its center. Learners consider different population distribution of the bills to determine a reasonable price for the duck.
PBS
The New West: Interactive Map | A Biography of America
Using this interactive map activity, from A Biography of America, explore how the "New West" evolved during the late 20th century, transforming from the wild, untamed Old Rocky Mountain West into a smaller, more accessible "New West."...
University of Southern California
How do Organisms Interact?
Examine how organisms interact through a hands-on experience. Learners study population dynamics and distribution during an informative five-lesson unit. The focus is on the ocean environment and the organisms within it.
EngageNY
Using Sample Data to Compare the Means of Two or More Populations II
The 23rd segment in a series of 25 presents random samples from two populations to determine whether there is a difference. Groups determine whether they believe there is a difference between the two populations and later use an...
EngageNY
Random Sampling
Sample pennies to gain an understanding of their ages. The 16th installment of a 25-part series requires groups to collect samples from a jar of pennies. Pupils compare the distribution of their samples with the distribution of the...
Statistics Education Web
Using Dice to Introduce Sampling Distributions
Investigate the meaning of a sample proportion using this hands-on activity. Scholars collect data and realize that the larger the sample size the more closely the data resembles a normal distribution. They compare the sample proportion...
Mathematics Vision Project
Module 8: Statistics
What does it mean to be normal in the world of statistics? Pupils first explore the meaning of a normal distribution in the eight-lesson module. They then apply the statistics related to normal distributions such as mean, standard...
Curated OER
Candy Bars
There is often more to data than meets the eye. Scholars learn that they need to analyze data before making conclusions as they look at data that describes the number of candy bars boys and girls eat. They disprove a given conclusion and...
Statistics Education Web
Who Sends the Most Text Messages?
The way you use statistics can tell different stories about the same set of data. Here, learners use sets of data to determine which person sends the most text messages. They use random sampling to collect their data and calculate a...
EngageNY
Sampling Variability in the Sample Proportion (part 1)
Increase your sample and increase your accuracy! Scholars complete an activity that compares sample size to variability in results. Learners realize that the greater the sample size, the smaller the range in the distribution of sample...
Achieve
BMI Calculations
Obesity is a worldwide concern. Using survey results, learners compare local BMI statistics to celebrity BMI statistics. Scholars create box plots of the data, make observations about the shape and spread of the data, and examine the...
Curated OER
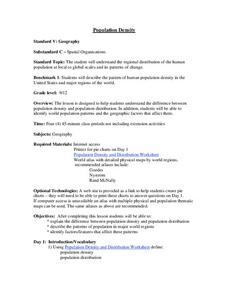
Population Density
Students examine world population density and population distribution. They create pie charts showing population distribution and analyze population patterns in the United States and major regions of the world. They identify...
Curated OER
The Demographics of Mortality
Students view the Dynamic POPClocks on the U.S. Census webpage and discuss their meaning. They explore age-related death rates of the human population and collect information about the deaths of humans and organize them into a life table.
Curated OER
The Ghost of Populations Past
Students study population distribution and survivorship curves by collecting data regarding age of death of humans from either tombstones, newspapers, or other community resources. Students analyze data by creating graphs and population...
Columbia University
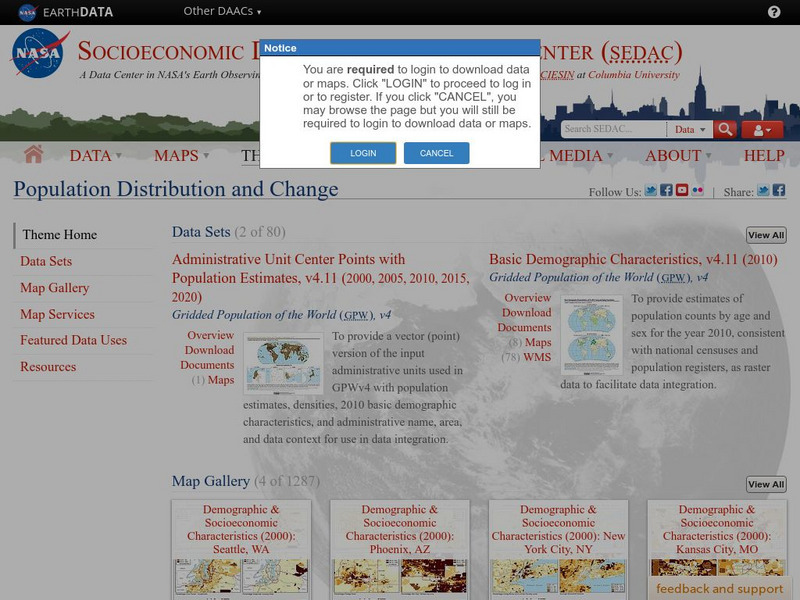
Nasa: Sedac: Population Distribution and Change
[Free Registration/Login Required] A collection of forty-nine data sets from SEDAC (Socioeconomic Data and Applications Center) that examine the distribution of human populations around the world and the changes that have taken place in...


