Howard Hughes Medical Institute
Population Dynamics
Will human population growth always be exponential, or will we find a limiting factor we can't avoid? Young scientists learn about both exponential and logistic growth models in various animal populations. They use case studies to...
Curated OER
Effects of Urban Growth
Learners explore population growth in the United States and the impact it has had on society. First, they brainstorm the reasons for population growth and the results of these increases. Then, they design surveys, record results, and...
US Department of Commerce
Community Change
America is a country on the move. Analyzing data from the Census Bureau, class members gauge the people moving in and out of their areas. An interactive web feature allows pupils to see who is moving out and moving in, while discussion...
US Department of Commerce
Featured Activity: Population Change Over Time
Keep track of a state's population. After a brief discussion on how population data is used for funding, individuals look at population changes over time. Pupils find the population of two states using three different censuses. They then...
Concord Consortium
People and Places
Graph growth in the US. Given population and area data for the United States for a period of 200 years, class members create graphs to interpret the growth over time. Graphs include population, area, population density, and population...
College Board
2008 AP® Environmental Science Free-Response Questions
Some of the oiliest creatures on earth may be the answer to our energy crisis! Using a four-question assessment, resource scholars consider the use of microalgae as fuel among other environmental science topics. Each question has several...
Serendip
Understanding and Predicting Changes in Population Size – Exponential and Logistic Population Growth Models vs. Complex Reality
Salmonella poisoning impacts over 200,000 people in the United States each year. Scholars learn about the growth of these bacteria using multiple approaches. Then they apply the same growth calculations to endangered species and think...
Population Connection
Where Do We Grow from Here?
Did you know that the population is expected to grow to 11 billion by 2100? The resource serves final installment in a six-part series on the global population and its effects. Scholars interpret data from the United Nations about the...
Science 4 Inquiry
The Ups and Downs of Populations
As the reality of population decline across many species becomes real, pupils learn about the variables related to changes in populations. They complete a simulation of population changes and graph the results, then discuss limiting...
Shodor Education Foundation
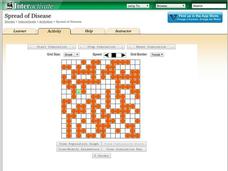
Spread of Disease
Control the spread of a contagious disease. An applet allows pupils to run a simulation on the spread of a disease. Rules govern how the disease is spread and the length of time it takes to recover. Learners view the spread visually and...
Shodor Education Foundation
Rabbits and Wolves
A change in a parameter can end in overpopulation. The resources gives pupils the opportunity to control the parameters of rabbits and wolves in a natural setting. Using the set parameters, the simulation runs and displays the population...
Shodor Education Foundation
Life
How does life evolve? The interactive provides a simulation based on the Game of Life invented by mathematician John Conway. Users can run the applet with the preset rules and settings or adjust them to view whether overpopulation or...
LABScI
Genetic Equilibrium: Human Diversity
Investigate the Hardy-Weinberg Principle to explain genetic equilibrium. The 10th lesson plan of a series of 12 is a laboratory exploration of genetic equilibrium. Your classes use a mixture of beans to model allele and genotype...
EngageNY
Using Sample Data to Estimate a Population Characteristic
How many of the pupils at your school think selling soda would be a good idea? Show learners how to develop a study to answer questions like these! The lesson explores the meaning of a population versus a sample and how to interpret the...
Curated OER
African American Population Shifts
Middle schoolers investigate population trends. In this African American history lesson, students access U.S. Census records from 1900 to the present online. Middle schoolers analyze the migration of African Americans from one area of...
Curated OER
The Motivation for Movement
Learners explore the geographic theme of movement. In this migration lesson, students discuss push-pull factors that motivate immigrants and interpret illegal immigration data. Learners also discuss the difficulties that illegals face.
Curated OER
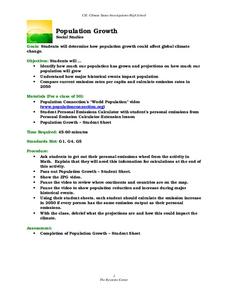
Population Growth
Students calculate human emission rate by year 2050. In this social studies lesson, students watch a video online and analyze population trends. They explain how e total emissions affect global climate.
Curated OER
Pop Quiz
In this geography skills practice worksheet, students respond to 12 multiple choice questions about world population statistics.
Curated OER
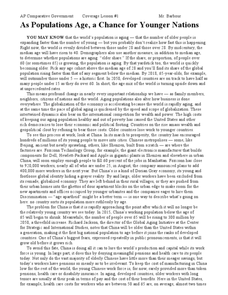
As Populations Age, a Chance for Younger Nations
In this geography skills worksheet, students read a 4-page article titled "As Populations Age, a Chance for Younger Nations." Students then respond to 4 short answer questions based on the content of the article.
Curated OER
Push and Pull Factors on Migration
Students investigate push and pull factors. In this population trends instructional activity, students examine primary sources that help them comprehend how push and pull factors have changed over time.
Curated OER
Tracing Migration Patterns
Seventh graders analyze migration patterns. In this migration lesson, 7th graders use U.S. Census records to trace the migration patterns of 2 German families in Kansas.
National Council of Teachers of Mathematics
Rough Rule
For this algebra activity, learners estimate the Canadian population using the rough rule. There are two questions.
Curated OER
Horizontal Bar Graph: Changes in Nebraska Population
In this bar graph worksheet, students learn about the changes in Nebraska's population from 1880 to 2000 by studying a bar graph. Students answer 7 questions about the graph.
Curated OER
Population Trends
Students explore, examine and study the differences and similarities in the average ages of the populations of two countries in the EU. They interpret tables, draw and interpret diagrams and assess interpretations of a statistical inquiry.


