Radford University
Regression Analysis Activity
Don't let your knowledge of regression analysis regress. Pupils take part in three activities to learn about regression curves. They research and collect data to predict how long it will take a basketball to hit the ground, find a...
Radford University
How Normal Are You?
It's completely normal to learn about normal distributions. An engaging lesson has young statisticians collect and analyze data about their classmates as well as players on the school's football team. They determine whether each set of...
Radford University
Danger! – An Analysis of the Death Toll of Natural Disasters
Decipher the danger of natural disasters. Using researched data, scholars work in groups to create data displays on the number of deaths from different types of natural disasters. They share their graphical representations with the class...
Florida Center for Reading Research
Comprehension: Monitoring for Understanding, What Do You Know?
An activity promotes reading comprehension. Readers analyze a text of their choice while activating prior knowledge and asking and answering questions. Scholars enforce multiple strategies to improve comprehension.
Purdue University
The Case of the Pilfered Pin: A Measurement Inquiry Activity
Who pilfered the pin? Scholars practice measurement skills as they solve the mystery of a stolen pin. They measure length, temperature, and mass and determine which of select suspects committed the crime. During the STEM hands-on...
American Statistical Association
Spinners at the School Carnival (Unequal Sections)
Everyone's a winner. Scholars analyze a spinner with five unequal sections, three of which represent winning a toy car and the other two represent winning a toy truck. They conduct an experiment to estimate the number of toy cars and...
American Statistical Association
Spinners at the School Carnival (Equal Sections)
Spin to win a toy car. A fun activity has pupils use a spinner in which three of the equal sections represent winning a toy car, and the fourth section represents no car. They record the number of wins after certain numbers of spins,...
Tune Into English
Yellow Submarine – The Beatles – Notes
Enhance English language skills using the fan-favorite song, "Yellow Submarine" by The Beatles. Scholars predict what the song is about then listen and mark specific words they hear. Playing the song again, participants unscramble lyrics...
California Education Partners
Science Fair Project
Plant the data firmly on the graph. Given information about the growth rate of plants, pupils determine the heights at specific times and graph the data. Using the information, scholars determine whether a statement is true and support...
Reed Novel Studies
Three Times Lucky: Novel Study
A car crash, a murder, a hurricane. With such a plot, why is the title of Sheila Turnage's novel Three Times Lucky? After making a prediction about the plot, scholars use the novel study to research and record facts about the United...
Reed Novel Studies
Tales of a Fourth Grade Nothing: Novel Study
Many turtle species can retreat their heads into their shells when threatened by predators. With the Tales of a Fourth Grade Nothing novel study, pupils conduct research to uncover other interesting turtle facts. As they explore Judy...
Concord Consortium
Gestation and Longevity
Is the gestation length of an animal a predictor of the average life expectancy of that animal? Learners analyze similar data for more than 50 different animals. They choose a data display and draw conclusions from their graphs.
NASA
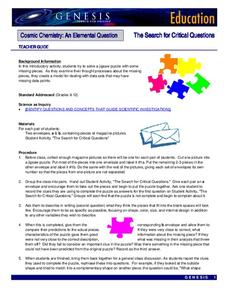
The Search for Critical Questions
A puzzle isn't about the individual pieces, but how they work together. Scholars assemble a puzzle and discover missing pieces. They write a description of what they expect these pieces to look like, including as many details as...
American Statistical Association
Scatter It! (Using Census Results to Help Predict Melissa’s Height)
Pupils use the provided census data to guess the future height of a child. They organize and plot the data, solve for the line of best fit, and determine the likely height and range for a specific age.
American Statistical Association
Scatter It! (Predict Billy’s Height)
How do doctors predict a child's future height? Scholars use one case study to determine the height of a child two years into the future. They graph the given data, determine the line of best fit, and use that to estimate the height in...
Project Maths
Introduction to Patterns
The world is full of patterns. Help learners quantify those patterns with mathematical representations. The first Algebra lesson in a compilation of four uses a series of activities to build the concept of patterns using multiple...
Kenan Fellows
Designing and Analyzing Data Collected from Wearable Devices to Solve Problems in Health Care
Wearable devices have become more the norm than the exception. Learners analyze data from a sample device with a regression analysis in a helpful hands-on instructional activity. Their focus is to determine if there is a connection...
Kenan Fellows
Lego Thinking and Building
Run a simulated airplane manufacturing plant with your pupils as the builders! Learners build Lego airplane models and collect data on the rate of production, comparing the number produced to the number defective. Using linear...
Kenan Fellows
Let's Move
Find a statistical reason for a fresh start. Using a hypothetical scenario, individuals research statistical data of three different cities. Their goal? Find the best statistical reason for a business to move to a new location. Their...
Novelinks
The Westing Game: Anticipation Guide
Are all criminals bad people? Pupils answer this and other compelling questions in an anticipation guide for The Westing Game by Ellen Raskin. Designed for learners to complete before reading the text, the...
101 Questions
Toothpicks
Analyze patterns and build functions. Young scholars work on their modeling skills with an inquiry-based lesson. After watching a video presentation of the problem, they write functions and make predictions.
101 Questions
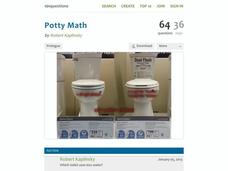
Potty Math
You don't want to flush your money down the drain! Have your classes complete a financial comparison between two different types of toilets. They use linear modeling to determine the most cost-effective model.
101 Questions
Rotonda West, FL
The shortest distance from point A to point B is a straight line—or is it? Young scholars determine the shortest route either along a circular path or through the center of the circle. Learners gain a unique perspective on arc length and...
Howard Hughes Medical Institute
Gorongosa: Scientific Inquiry and Data Analysis
How does the scientific process begin? Introduce ecology scholars to scientific inquiry through an insightful, data-driven lesson. Partners examine data from an ongoing research study to determine the questions it answers. The resource...


