American Statistical Association
How Long Are the Words in the Gettysburg Address?
It's 268 words, but one only needs to consider 10 of them at a time. A data collection and analysis activity has learners investigate the lengths of words in the Gettysburg Address. They first self-select a sample of 10 words and...
American Statistical Association
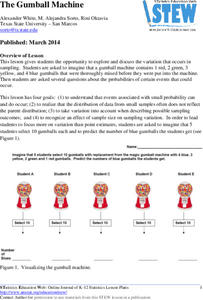
The Gumball Machine
Chew on an activity for probability. Given information on the number of gumballs in a gumball machine, scholars consider how likely it is to randomly draw a blue gumball and how many of each color they would draw in 10 trials if the...
Flipped Math
Sampling Methods
Pupils watch a video to learn about different types of sample design and how to use technology to create a random sample. They discover different types of bias that may happen due to the sampling design or the questions. Learners use...
US Department of Commerce
Sample Means - Exploring Sampling Variability
Sample an excellent resource on sampling variability. Pupils analyze census data on the percentage of homes in each state that have Internet access. They take random samples of different sample sizes, determine the sample means, and then...
Radford University
PHamily PHeud: An Exploration in Surveys
Get to know the class much better. Scholars brainstorm a topic of interest and then design and conduct a class survey. Using the top responses, they create a game similar to Family Feud and take part in a class competition.
Radford University
Survey Activity
It's time to take a survey. After looking at an example of a survey on lunch preferences, groups design their own surveys. They consider the sample size and sampling technique, then conduct the surveys. As a final activity, they create...
Radford University
Understanding Local Economic Issues Using Statistics
A good understanding of local economics requires a lot of data. Scholars design and conduct an experimental survey to collect information about economic issues affecting their regions. They analyze their findings and prepare a...
American Statistical Association
Confidence in Salaries in Petroleum Engineering
Just how confident can we be with statistics calculated from a sample? Learners take this into account as they look at data from a sample of petroleum engineer salaries. They analyze the effect sample size has on a margin of error and...
Howard Hughes Medical Institute
Sampling and Normal Distribution
Young scientists learn about sampling and normal distributions through data analysis. A worksheet guides them to better understanding and synthesis of knowledge.
CK-12 Foundation
Sampling Distribution of a Sample Mean: The Mean of the Average Ages
What does it mean to take the mean of the mean? An easy-to-use interactive has users adjust the mean ages of different samples. Finding the average of these sample means gives an estimate of the population mean.
CK-12 Foundation
Stratified Random Sampling: An Extracurricular Study
Learning isn't a random process. A well-designed interactive lesson helps classes make key conclusions about stratified random sampling. They calculate group percentages and use those percentages to decide on sampling totals.
CK-12 Foundation
Simple Random Sampling: How Many Samples Does it Take to Change a Light Bulb?
Teach the concept of simple random sampling through an interactive lesson. Learners explore the concept by considering the strength of sampling methods. Size of the samples varies also as individuals determine which methods lead to the...
EngageNY
Understanding Variability When Estimating a Population Proportion
Estimate the proportion in a population using sampling. The 20th installment in a series of 25 introduces how to determine proportions of categorical data within a population. Groups take random samples from a bag of cubes to determine...
EngageNY
End-of-Module Assessment Task: Grade 7 Mathematics Module 5
Show learners how to use simulations and random sampling to reach conclusions with the last resource in a 25-part series. The assessment contains three scenarios, each with several parts, and covers comparing populations using...
EngageNY
Estimating a Population Proportion
Find the percent of middle schoolers who want the ability to freeze time. The 21st installment in a series of 25 has groups collect a random sample of respondents who answer a question about superpowers. Using sample statistics,...
EngageNY
Sampling Variability and the Effect of Sample Size
The 19th installment in a 25-part series builds upon the sampling from the previous unit and takes a larger sample. Pupils compare the dot plots of sample means using two different sample sizes to find which one has the better variability.
Statistics Education Web
It’s Elemental! Sampling from the Periodic Table
How random is random? Demonstrate the different random sampling methods using a hands-on activity. Pupils use various sampling techniques to choose a random sample of elements from the periodic table. They use the different samples to...
Statistics Education Web
Using Dice to Introduce Sampling Distributions
Investigate the meaning of a sample proportion using this hands-on activity. Scholars collect data and realize that the larger the sample size the more closely the data resembles a normal distribution. They compare the sample proportion...
Bowland
Soft Drinks
"Statistics are no substitute for judgment" - Henry Clay. Young mathematicians use provided statistics from a soda taste test to explain why conclusions are faulty. They devise a new test that would be more appropriate than the one given.
Balanced Assessment
Movie Survey
Movie preferences will get your classes talking! Individuals read a pie graph and construct a bar graph using the same information. They then answer questions specific to the data and sample size.
Statistics Education Web
Population Parameter with M-and-M's
Manufacturers' claims may or may not be accurate, so proceed with caution. Here pupils use statistics to investigate the M&M's company's claim about the percentage of each color of candy in their packaging. Through the activity,...
Curated OER
Candy Bars
There is often more to data than meets the eye. Scholars learn that they need to analyze data before making conclusions as they look at data that describes the number of candy bars boys and girls eat. They disprove a given conclusion and...
Statistics Education Web
Who Sends the Most Text Messages?
The way you use statistics can tell different stories about the same set of data. Here, learners use sets of data to determine which person sends the most text messages. They use random sampling to collect their data and calculate a...
Mathematics Assessment Project
Evaluating Statements about Probability
Learners first complete an assessment task where they assess statements on probability. They then sort cards containing probability statements as being either true or false.


