Better Lesson
Better Lesson: Analyze This Part 2!
Srudents connect mean, median, mode and range to real life. It will allow students to make sense of problems by using previously taught strategies.
Better Lesson
Better Lesson: Mean Absolute Deviation. What Does It Mean?
The students will be working with mean and learning about variability. They will be making connections to real life applications to help assist them in making a connection to mean absolute deviation.
Shodor Education Foundation
Shodor Interactivate: Measures
Enter data and view the mean, median, variance, and standard deviation of the data set.
Shodor Education Foundation
Shodor Interactivate: Skew Distribution
Change the median and standard deviation of an automatically generated normal distribution to create a skewed distribution, allowing you to observe properties like what it means for the mean, median, and mode to be different.
Shodor Education Foundation
Shodor Interactivate: Plop It!
PlopIt allows users to build dot plots of data using the mouse. View how the mean, median, and mode change as entries are added to the plot.
CK-12 Foundation
Ck 12: Algebra Ii: 5.5 Sampling Variability
This section explores the concept of sampling variability in the sample proportion. It will address the effect on the mean and standard deviation of a sample distribution as the sampling size changes.
CK-12 Foundation
Ck 12: Algebra Ii: 6.6 the T Test
Learn about a statistical test that is used to compare the means of two groups, the T Test.
CK-12 Foundation
Ck 12: Algebra Ii: 6.5 Confidence Intervals
Explore the idea of a confidence interval where it is easier to predict that an unknown value will lie somewhere within a wide range, than to predict it will occur within a narrow range.
CK-12 Foundation
Ck 12: Algebra Ii: 6.3 Z Scores
See how Z-scores are related to the Empirical Rule from the standpoint of being a method of evaluating how extreme a particular value is in a given set.
CK-12 Foundation
Ck 12: Algebra Ii: 5.8 Evaluating Reports
Learn to analyze examples of claims presented in the media that involve estimating a population proportion and population mean.
Khan Academy
Khan Academy: Center and Spread Lesson
The resource from Khan Academy provides practice questions for the Praxis Core Math Test. This section reviews probability and statistics questions connected to the center and spread of data in a collection.
PBS
Pbs Learning Media: Central Tendency: Targeted Math Instruction
At the end of this lesson, students will be able to recognize and apply the concepts of mean, median, and mode in real-life problems.
Shodor Education Foundation
Shodor Interactivate: Misleading Graphs
This lesson will challenge young scholars to think creatively by having them design and build water balloon catchers from random scrap materials, while requiring them to take into consideration a multitude of variables including cost,...
Louisiana Department of Education
Louisiana Doe: Louisiana Believes: Eureka Math Parent Guide: Statistics
A guide to support parents as they work with their students with statistics.
Purple Math
Purplemath: Ratios
Explains the basic terminology and formatting of ratios, and demonstrates how to solve typical exercises.
E-learning for Kids
E Learning for Kids: Math: Olive Trees: Data & Chance
Ariel is taking a survey. Do you want to help her collect and describe data?
National Council of Teachers of Mathematics
Nctm: Comparing Properties of the Mean and Median
Through the use of technology, students can investigate how the mean and median of a set of date compares when values the data changes.
University of Wisconsin
University of Wisconsin: Measures of Central Tendency
This resource provides information about measures of central tendency.
University of Illinois
University of Illinois: Introduction to Descriptive Statistics
A series of explanations of statistics terms based on the statistics from a dice game.
Shodor Education Foundation
Shodor Interactivate: Lesson: Stem and Leaf Plots
Lesson plan introduces young scholars to stem-and-leaf plots. Many resources are available for student and teachers here.
Wolfram Research
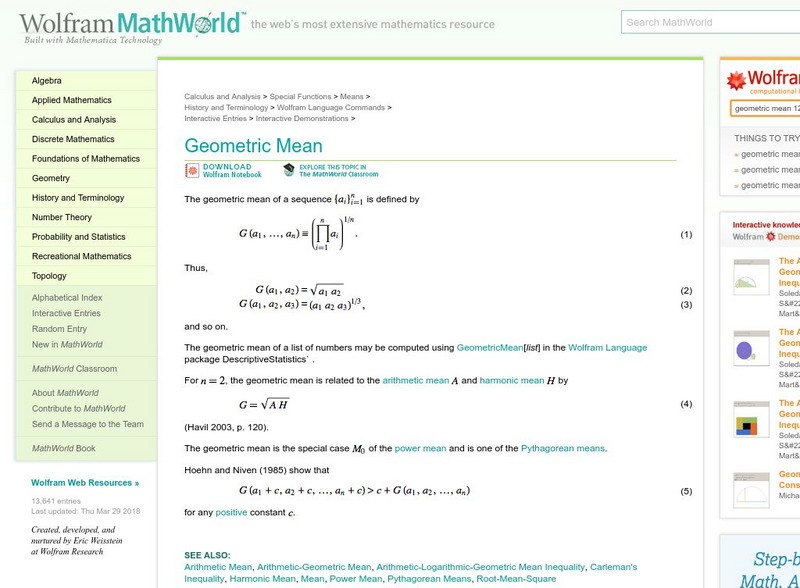
Wolfram Math World: Geometric Mean
Geometric mean is defined, yet there are no links to help with notation at this MathWorld site. Still a good site to clarify your understanding of this geometric term.
Primary Resources
Primary Resources: Mean, Median, Mode, and Range
Here are some teacher resources to aid in teaching mean, median, mode and range. Includes worksheets, games, and PowerPoint presentations.
Rice University
Hyper Stat Online Statistics Textbook: Arithmetic Mean
This resource gives a definition of a mean and provides a formula for finding a statistical mean.
Rice University
Hyper Stat Online Statistics Textbook: Summary of Measures of Central Tendency
Site discusses which method of central tendency is most appropriate for different purposes.


