Math Slice
Math Slice: Statistics: Math Worksheets
This tool allows you to create worksheets where students calculate the mean, median, mode or range of a set of numbers.
That Quiz
That Quiz: Medias
This interactive activity is designed as a review to the concept of mean, median and mode.
Purple Math
Purplemath: Proportions: Introduction
Explains the basics and terminology of proportions.
University of Illinois
University of Illinois: Rollin' Rollin' Rollin'
This resource is the beginning of a series of pages that demonstrates the diffference between the mean and median of a group of numbers. Uses bar graphs to display the data.
University of Illinois
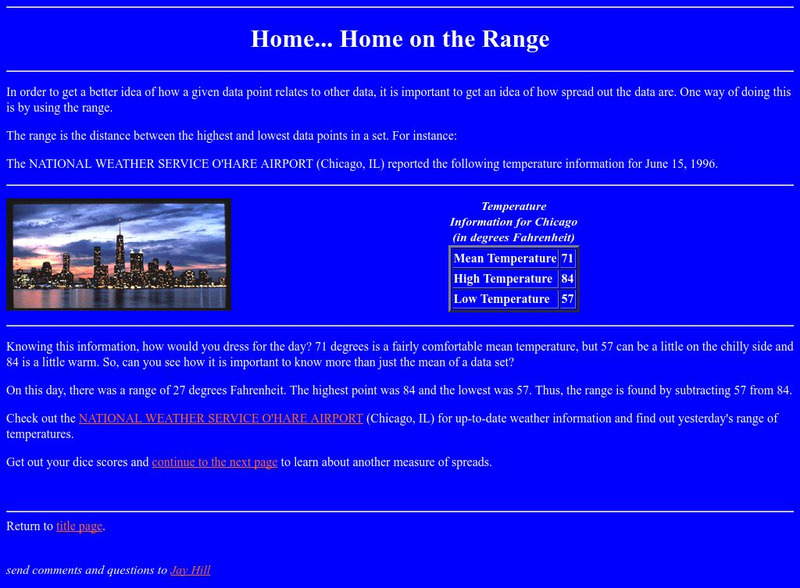
University of Illinois: Home, Home on the Range
This site from the University of Illinois contains an introduction and definition of the term range. It has a link to the National Weather Service so students can practice finding the range using the available weather data.
Other
Meta Calculator: Statistics Calculator
A web-based statistics calculator to find mean, median, standard deviation, variance and ranges.
BBC
Bbc: Standard Deviation
A demonstration of how to find the standard deviation of a set of data. Several examples and a practice test are offered.
Math Is Fun
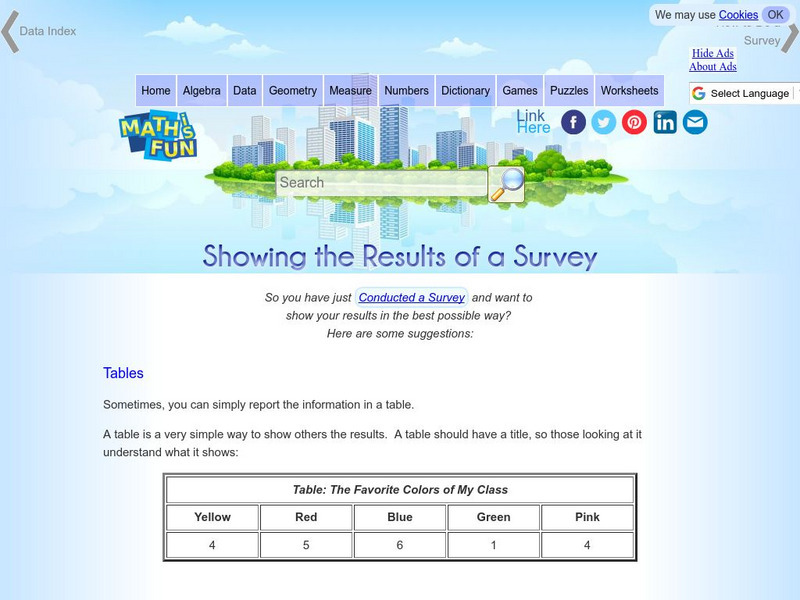
Math Is Fun: Showing the Results of a Survey
A variety of ways to display the results of a survey are listed, including tables, statistics and different types of graphs.
BBC
Bbc Bitesize: How to Find Mean, Median, Mode, and Range
This ten question quiz will help you assess your understanding of mean, median, and mode. Links are provided that allow you to enlarge the quiz to fit your full screen, see the quiz in a different format, review the definitions of mean,...
Free Math Help
Free Math Help: Batting Average
Here is an explanation about how to calculate a player's batting average.
Education Place
Houghton Mifflin: Eduplace: Extra Practice Quiz Mean, Median, Mode, Range 2
Practice using the graph to answer questions about the mean, median, mode and range. Read the interactive quiz rules and then click on the "Begin" ticket. If you answer incorrectly you get one more chance to try again then you are told...
Education Place
Houghton Mifflin: Eduplace: Extra Practice Quiz Mean, Median, Mode, Range 1
Practice using the graph to answer questions about the mean, median, mode and range. Read the interactive quiz rules and then click on the "Begin" ticket. If you answer incorrectly you get one more chance to try again then you are told...
Education Place
Houghton Mifflin: Eduplace: Math Steps: What Is It? Data
This is a great place for lesson information on the concept of analyzing data - measures of central tendency. Three other tabs are available besides the "What Is It?" link. Tips and Tricks, When Students Ask, and Lesson Ideas also...
Calculator Soup
Calculator Soup: Statistics Calculator
Calculate basic summary statistics for a sample or population data set including minimum, maximum, range, sum, count, mean, median, mode, standard deviation and variance.
Calculator Soup
Calculator Soup: Mean Calculator | Average Calculator
In statistics the mean of a set of numbers is the average value of those numbers. Find the average or mean by adding up all the numbers and dividing by how many numbers are in the set.
Calculator Soup
Calculator Soup: Variance Calculator
Variance is a measure of dispersion of data points from the mean. Low variance indicates that data points are generally similar and do not vary widely from the mean. High variance indicates that data values have greater variability and...
AAA Math
Aaa Math: Statistical Mean
Learn about finding the statistical mean of a set of data, and then do some practice problems.
University of Glasgow
Steps Statistics Glossary: Sample Mean
The definition of a sample mean is provided along with the symbol commonly used for it and an example to show the formula in action. A link to "expected value" - a related topic - is provided.
Curated OER
Image for Mean
An overview of the statistical term, "mean." An example is provided for explanation. Links are given to other related terms: central limit theorem, population, median, and mode.
Curated OER
Computing Mean, Variance and Standard Deviation
Page centered around a computer program to determine mean, variance, and standard deviation.


