American Statistical Association
The Mean and Variability from the Mean
Discover the mean from fair share to the balance point. The instructional activity takes small groups of pupils through two different interpretations of the mean, the fair share understanding of the mean, and the balance point. Scholars...
Utah Education Network (UEN)
Statistics
Find the value in analyzing data values. Statistics is the focus in the fifth of seven installments of the 6th Grade Math series. Individuals learn to examine dot plots, histograms, and box plots by considering the shape, mean, median,...
McGraw Hill
Lesson 12: Absolute Mean Deviation
Learn a different way to determine variability. An informative lesson provides directions on how to calculate the mean absolute deviation of a data set. Pupils use examples to learn the process and then practice finding the mean absolute...
American Statistical Association
How Fast Are You?
Quick! Snap up the lesson. Scholars first use an online app to collect data on reaction times by clicking a button when the color of a box changes. They then plot and analyze the data by considering measures of center, measures of...
Thinkport Education
Thinkport: Algebra Ii: Standard Deviation
Begin by reviewing mean absolute deviation as a measure of variability. Your new learning will begin with standard deviation and understanding the difference between mean absolute deviation and standard deviation.
Khan Academy
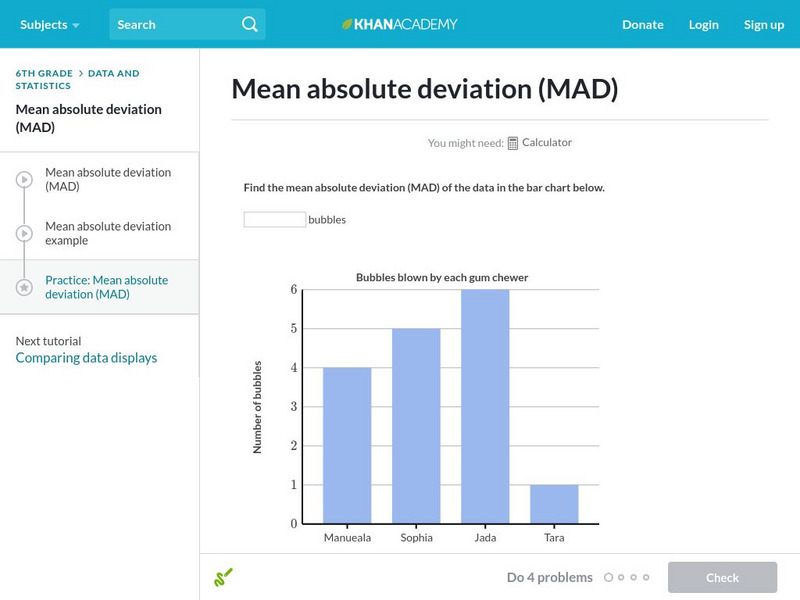
Khan Academy: Mean Absolute Deviation (Mad)
Practice calculating the mean absolute deviation.
Illustrative Mathematics
Illustrative Mathematics: 7.sp.3,4 College Athletes
Below are the heights of the players on the University of Maryland women's basketball team for the 2012-2013 season and the heights of the players on the women's field hockey team for the 2012 season. (Accessed at...
Louisiana Department of Education
Louisiana Doe: Louisiana Believes: Eureka Math Parent Guide: Statistics
A guide to support parents as they work with their students with statistics.


