Curated OER
Table Readings
In this table worksheet, students read questions and interpret tables. Questions include information concerning unemployment, oil imports, and foreign students. This multiple-choice worksheet contains 10 problems. Answers are provided.
Curated OER
Beyond Averages: Median, Mode and Range
In this median, mode and range learning exercise, students complete a set of 10 multiple choice questions, clicking on an answer link to view correct answers.
Curated OER
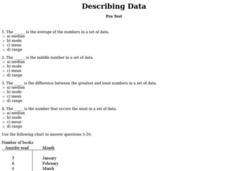
Describing Data
In this data activity, students complete multiple choice questions about mean, median, mode, and range. Students complete 10 questions total.
Curated OER
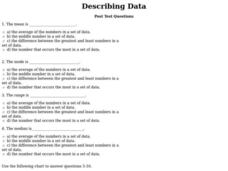
Describing Data
For this describing data worksheet, students answer multiple choice questions about mean, median, mode, and range. Students complete 10 questions total.
Curated OER
Mean, Median, and Mode
Young scholars calculate measures of central tendency. in this mean, median, and mode lesson, students calculate the measures of central tendency. They organize data, examine and explain the statistics.
Curated OER
Makiing Sense of the Census
Students investigate trends in agriculture. In this secondary mathematics lesson, students evaluate agricultural census data from 1982 to 2202 as they compare the properties of the mean and the median. Students explore what sorts of...
Curated OER
Campaign 2000
Students research newspapers and the Internet to learn about the election. Students work in groups and choose a state that they want to compare to Florida. Students organize the data they have found into a graph labeling an "x" and "y"...
Curated OER
Mean, Median, and Mode
In this mean, median, and mode worksheet, students find the mean, median, and mode for 4 sets of numbers and answer short answer questions about them. Students answer 5 short answer questions.
Curated OER
Using mean, median, and mode
In this mean, median, and mode activity, students read how to use each method and then complete problems using each one. Students complete 8 problems.
Curated OER
Chapter Books
In this line plot instructional activity, students create a line plot of the chapter books read by the students of a class and find the median and mode. Students complete 3 tasks.
Curated OER
Box-and-Whisker Plots
Students explore nutritional information for several fast food hamburgers using statistical applications. In this statistics instructional activity, students analyze calories, fat, and sodium content of various fast food restaurants....
Curated OER
My Peanut Butter is Better Than Yours!
Students explore the concept of statistical data. In this statistical data lesson, students read an article about the dangers of peanut butter to those who are allergic. Students perform a taste test of two different brands of peanut...
Curated OER
Mean, Median and Mode
Fourth graders describe weather data using the mean, median and mode. In this mean, median and mode lesson, 4th graders understand how to calculate data using mean, median and mode and why they would use each one.
Curated OER
Are Taxes "Normal?"
Students explore the concept of normal distribution. In this normal distribution lesson plan, students find the normal distribution of taxes in the 50 US states. Students make histograms, frequency tables, and find the mean and median of...
Curated OER
Box and Whisker Plots
Seventh graders explore the concept of box and whisker plots. In this box and whisker plots lesson, 7th graders plot data on a box and whisker plot. Students discuss the mean, median, and mode of the data. Students discuss range,...
Curated OER
Mean, Median and Range
In this measures of central tendency activity, learners solve 6 problems. Students analyze the set of given numbers and calculate the median, mean and range for each.
Curated OER
Out to Lunch
Sixth graders create a menu. In this math lesson, 6th graders use mean, median and mode to determine the prices for the typical cost of an appetizer, entree, kid's meal, drinks and dessert. Students write a number sentence to show how...
Curated OER
Averaging
Sixth graders explore the concept of mean, median, mode, and range. In this mean, median, mode, and range lesson, 6th graders work in groups to find the mean, median, mode, and range of their heights, distance from home to school, time...
Curated OER
Midterm 1 Exam: Statistics
In this statistics worksheet, students determine the mean, variance, standard deviation and median of given statistical data. They organize data, create box-and-whisker plots and identify outliers. This nine-page worksheet contains 7...
Curated OER
Data Analysis
In these data analysis worksheets, students complete 4 worksheets of activities for analyzing data. Students use the mean, median, mode, and range to organize the data.
Curated OER
Mode, Median, and Mean
Students define mode, median and mean, and perform mathematical operations to determine these 3 terms. In this statistics/math lesson, students practice memory strategies to help distinguish between mode, median, and mean. Students apply...
Curated OER
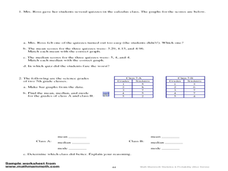
Mode, Median, and Mean
In this measures of central tendency worksheet, students determine the mode, median, and mean of a given data set based on children's test scores. They fill in a tally chart and answer 6 questions based on the data.
Curated OER
Classifying Triangles
In this classifying triangles worksheet, 10th graders solve and complete 11 different types of problems. First, they state whether each segment shown is an altitude, median, or neither. Then, students solve for x and find the requested...
Curated OER
Mean, Median and Mode
For this mean, median and mode worksheet, students solve 6 problems involving mean, median and mode. Students are given a "hint" for problems 1 and 2.


