Shodor Education Foundation
Shodor Interactivate: Box Plot
Students can create box plots for either built-in or user-specified data as well as experiment with outliers. User may choose to use or not use the median for calculation of interquartile range.
Shodor Education Foundation
Shodor Interactivate: Measures
Enter data and view the mean, median, variance, and standard deviation of the data set.
Shodor Education Foundation
Shodor Interactivate: Skew Distribution
Change the median and standard deviation of an automatically generated normal distribution to create a skewed distribution, allowing you to observe properties like what it means for the mean, median, and mode to be different.
Shodor Education Foundation
Shodor Interactivate: Plop It!
PlopIt allows users to build dot plots of data using the mouse. View how the mean, median, and mode change as entries are added to the plot.
Math Open Reference
Math Open Reference: Medians of a Triangle
Learn about the medians of a triangle with this helpful reference tool. Provides a detailed definition and internet activities that enhance further explanation. Includes links to related topics.
Cuemath
Cuemath: Median
A comprehensive guide for learning all about the median with definitions, how to find it, solved examples, and practice questions.
Khan Academy
Khan Academy: Center and Spread Lesson
The resource from Khan Academy provides practice questions for the Praxis Core Math Test. This section reviews probability and statistics questions connected to the center and spread of data in a collection.
CK-12 Foundation
Ck 12: Interactive Geometry: 4.5 Theorems About Concurrence in Triangles
Find out about some common centers of triangles.
PBS
Pbs Learning Media: Central Tendency: Targeted Math Instruction
At the end of this lesson, students will be able to recognize and apply the concepts of mean, median, and mode in real-life problems.
Shodor Education Foundation
Shodor Interactivate: Misleading Graphs
This lesson will challenge young scholars to think creatively by having them design and build water balloon catchers from random scrap materials, while requiring them to take into consideration a multitude of variables including cost,...
Louisiana Department of Education
Louisiana Doe: Louisiana Believes: Eureka Math Parent Guide: Statistics
A guide to support parents as they work with their students with statistics.
Purple Math
Purplemath: Quartiles, Boxes, and Whiskers
Explains how to construct a simple box-and-whisker plot, and demonstrates the steps. Discusses quartiles and medians, shows how to find them, and explains how they relate to box-and-whisker plots.
Other
Nearpod: Displaying Data: Box Plots
In this lesson, students will learn how to create and intrepret box plots using the 5-number summary.
E-learning for Kids
E Learning for Kids: Math: Olive Trees: Data & Chance
Ariel is taking a survey. Do you want to help her collect and describe data?
National Council of Teachers of Mathematics
Nctm: Comparing Properties of the Mean and Median
Through the use of technology, students can investigate how the mean and median of a set of date compares when values the data changes.
University of Wisconsin
University of Wisconsin: Measures of Central Tendency
This resource provides information about measures of central tendency.
Shodor Education Foundation
Shodor Interactivate: Lesson: Stem and Leaf Plots
Lesson plan introduces young scholars to stem-and-leaf plots. Many resources are available for student and teachers here.
Wolfram Research
Wolfram Math World: Triangle Median
MathWorld provides an example and explanation for the median of a triangle. Lines A1M1, A2M2, and A3M3 are the medians of triangle A1A2A3.
Shodor Education Foundation
Shodor Interactivate: Dictionary: Median
This interactive dictionary page contains the definition of median with a description of how to find the median from a list of numbers. Be sure to follow the link to a discussion on mean, median and mode.
Primary Resources
Primary Resources: Mean, Median, Mode, and Range
Here are some teacher resources to aid in teaching mean, median, mode and range. Includes worksheets, games, and PowerPoint presentations.
Rice University
Hyper Stat Online Statistics Textbook: Median
This resource gives a definition of a median and tells you how to compute it.
Rice University
Hyper Stat Online Statistics Textbook: Summary of Measures of Central Tendency
Site discusses which method of central tendency is most appropriate for different purposes.
Ministry of Education and Universities of the Region of Murcia (Spain)
Ministerio De Educacion Y Ciencia: Baricentro De Un Triangulo
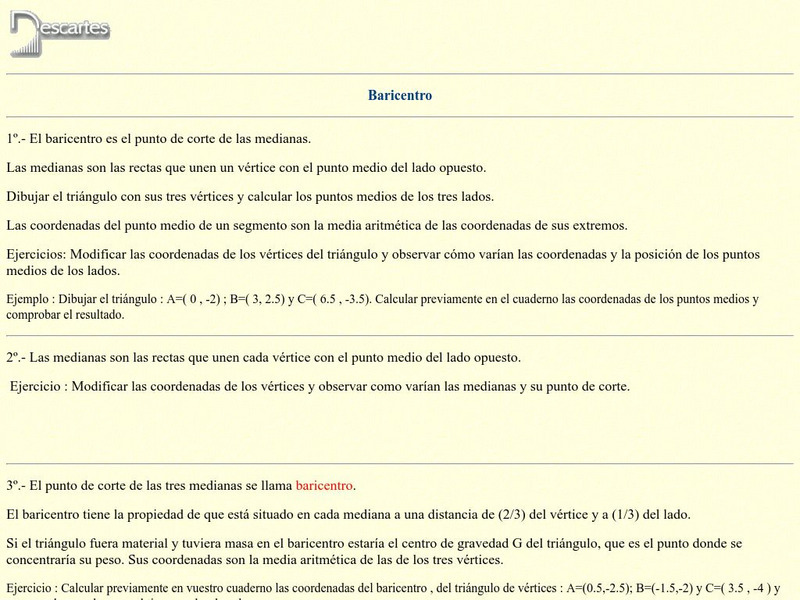
Discover how to find the centroid of a triangle with this interactive activity. [Requires Java.]
PBS
Pbs Mathline: Whirlybirds [Pdf]
This engaging lesson combines the concepts of statistics and measurement. Learners create a simulation of a parachute jump using whirlybirds, to predict the frequency of an event occurring. A detailed lesson plan which includes a list of...


