Other
Nmu: Box and Whisker Plot Instructions
Site discusses the use of box-and-whisker plots. An example is presented and completely worked through, so that the user can see the results of the calculations after the steps have been explained.
Other
College of Natural Sciences: Measures of Location
Different measures of location are discussed in terms of box and whisker plots.
Other
James Wright: Measures of Central Tendency
This site looks at measures of central tendency and dispersion. Discussed are topics such as standard deviation, mean, median, and mode.
Sophia Learning
Sophia: Finding Mean, Median, and Mode: Lesson 5
This lesson will demonstrate how to find the mean, median, and mode for a set of data. It is 5 of 5 in the series titled "Finding Mean, Median, and Mode."
Sophia Learning
Sophia: Median: Lesson 6
This lesson defines the term median. It is 6 of 14 in the series titled "Median."
Sophia Learning
Sophia: Medians of a Triangle: Lesson 5
This lesson introduces the medians of a triangle. It is 5 of 6 in the series titled "Medians of a Triangle."
Sophia Learning
Sophia: Using Different Measures of Central Tendency: Lesson 3
This lesson demonstrates how the different measures of central tendency can cause you to look at data differently. It is 3 of 5 in the series titled "Using Different Measures of Central Tendency."
Soft Schools
Soft Schools: Outliers
On this websites students explore the concept of outliers. Students are given several data sets and investigate how outliers can effect the mean and median of a data set.
Sophia Learning
Sophia: Using Different Measures of Central Tendency: Lesson 4
This lesson demonstrates how the different measures of central tendency can cause you to look at data differently. It is 4 of 5 in the series titled "Using Different Measures of Central Tendency."
ClassFlow
Class Flow: Statistics Landmarks Vote
[Free Registration/Login Required] This lesson uses clustering to explore the concept of mean, median, and mode of a set of data and calculates the arithmetic mean.
ClassFlow
Class Flow: Triangle Segments
[Free Registration/Login Required] In this flipchart, students use the interactive features of Activstudio to understand how to use the properties of perpendicular bisectors, angle bisectors, medians and altitudes of a triangle.
Free Math Help
Free Math Help: Median
Students learn how to find the median of a dataset. The tutorial consists of a definition and example.
Varsity Tutors
Varsity Tutors: Hotmath: Algebra Review: Mode, Mean and Median
Find a quick, concise explanation of a mode. An example is given and clearly explained. Mean and median are also explained.
ClassFlow
Class Flow: Analyzing Data Mean, Median and Mode
[Free Registration/Login Required] Explores ways of analyzing data in a table.
ClassFlow
Class Flow: Box and Whiskers Plot
[Free Registration/Login Required] This is an interactive flipchart for ordering the steps for plotting a box and whiskers. It also allows students to determine the minimum, maximum, median, upper and lower quartiles. Students will also...
ClassFlow
Class Flow: Mean, Median, and Mode
[Free Registration/Login Required] This flipchart contains a video, notes, and rolling dice activity on mean, median and mode.
ClassFlow
Class Flow: Mean, Median, Mode
[Free Registration/Login Required] Use this flipchart to help teach your students about Mean, Median, and Mode. Be ready to pull out the random number generator. Your students will be fully engaged as the dice are rolling.
ClassFlow
Class Flow: Mean, Median, Mode and Range
[Free Registration/Login Required] This interactive flipchart provides an overview of mean, median, mode, and range.
ClassFlow
Class Flow: Mean, Median, Mode, and Range
[Free Registration/Login Required] This flipchart describes the basics of mean, median, mode, and range.
Math Is Fun
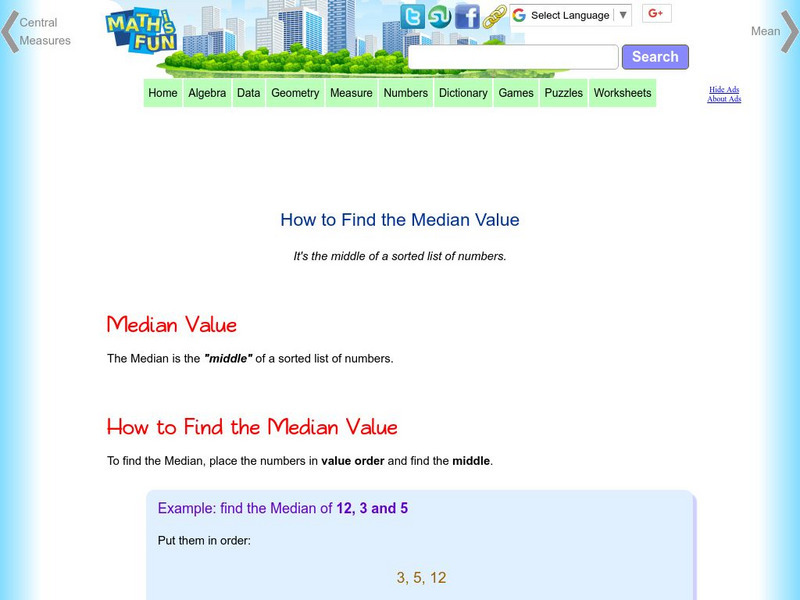
Math Is Fun: How to Find the Median Value
This math tutorial provides an explanation of the median value for a groups of numbers.
ClassFlow
Class Flow: Mean, Mode, Median, and Range
[Free Registration/Login Required] This is a flipchart about mean, mode, median, and range. It also has an assessment using Activotes.
Math Slice
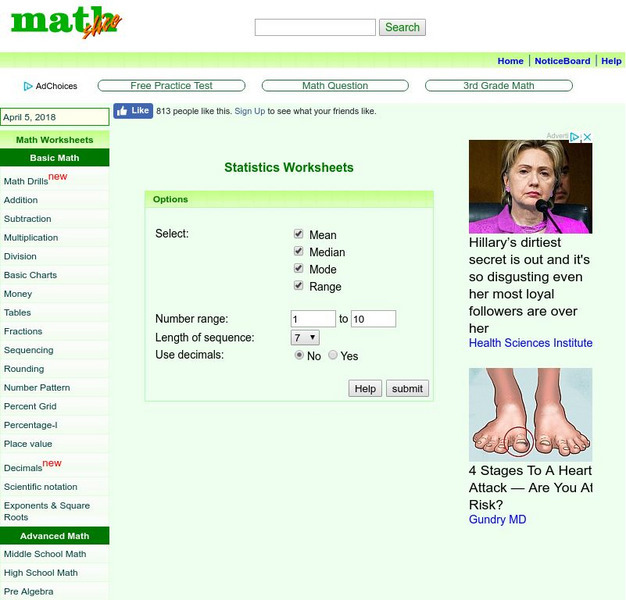
Math Slice: Statistics: Math Worksheets
This tool allows you to create worksheets where students calculate the mean, median, mode or range of a set of numbers.
That Quiz
That Quiz: Medias
This interactive activity is designed as a review to the concept of mean, median and mode.
University of Illinois
University of Illinois: Rollin' Rollin' Rollin'
This resource is the beginning of a series of pages that demonstrates the diffference between the mean and median of a group of numbers. Uses bar graphs to display the data.


