National Wildlife Federation
The Tide is High, but I’m Holding On… Using ICESat Data to Investigate Sea Level Rise
Based on the rate of melting observed from 2003-2007 in Greenland, it would take less than 10 minutes to fill the Dallas Cowboys' Stadium. The 17th instructional activity in a series of 21 has scholars use the ICESat data to understand...
US Department of Energy
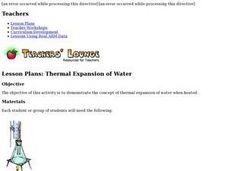
Thermal Expansion of Water: Rise of Sea Level
Using bunsen burners, Erlenmeyer flasks, thermometers, hollow glass tubes, stoppers, and rulers, learners experiment with and measure how water expands when heated. The activity connects the expansion of water when heated to global...
NASA
The Big Climate Change Experiment Lesson 3: Climate Change Lines of Evidence
Consider the preponderance of evidence when making a verdict. The third of five lessons in Unit 1: The Big Climate Change Experiment focuses on the evidence for climate change. Learners study graphs, diagrams, and pictures regarding...
NASA
Mapping the Watery Hills and Dales
How does GPS know where everything is located? Pupils read about satellites that are mapping the ocean and the question on how satellites know where they are. Readers discover the workings of the Global Positioning System and create...
University of Waikato
Investigating Sea Level Rise
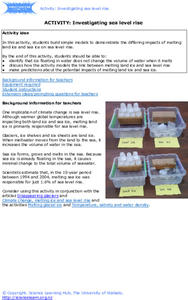
Find an explanation for the sea level rise. Pupils investigate the difference that melting land ice and sea ice have on the sea level. Groups create two models—one with ice on land and one with ice in the water. As the ice melts, teams...
College Board
2010 AP® Environmental Science Free-Response Questions
Scientists rely heavily on data to make predictions and find solutions. Young scholars become scientists as they analyze information presented to them to construct responses. They consider scenarios related to air pollution, invasive...
NOAA
Investigating Sea Level Using Real Data
The news reports on rising sea level, but how do scientists measure this rise? Scholars use NOAA data including maps, apps, and images to work through five levels of activities related to sea level. Each level in the series adds a new...
Colorado State University
Can You Drink Through a 30 Foot Straw?
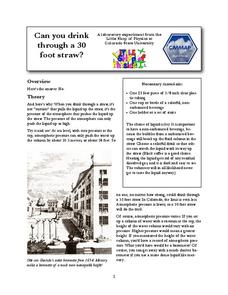
Drinking straws are a pretty simple device ... or, are they? Explore the possibility of sipping a beverage 30 feet away with an engaging activity that's sure to keep pupils guessing. Just place a long piece of plastic tubing in a glass,...
NOAA
Tides
Sometimes low, sometimes high, but always in motion! Explore Earth's tidal system in the 10th interactive in a series of 13. Engaging life and earth science students alike, the versatile resource demonstrates cause and effect between...
Space Awareness
Oceans on the Rise
Temperature rises and land disappears! Through a lab exploration, learners understand the effect of temperature increase on water similar to the effect of global warming on our oceans. As they heat the water in a flask, they measure the...
NOAA
Where Have All the Glaciers Gone?
What happens when ice melts? Well ... water happens. When that melting ice is a glacier, the amount of water that results produces change throughout the world. Middle school science sleuths uncover the truth about global...
Space Awareness
The Big Meltdown
Explore the world (our world) of melting ice caps. Why are these caps melting? What is the effect of melting ice caps? Dive into the ever-present issue of global warming with a resource that has learners looking at data and participating...
NOAA
Tracking a Drifter
Be shore to use this drifter resource. The third installment of a five-part series has learners using the NOAA's Adopt-a-Drifter website to track to movement of a drifter (buoy) in the ocean. Graphing the collected data on a map allows...
Global Oneness Project
A Vanishing Island
The effects of rising sea levels on Isle de Jean Charles, located off the coast of Louisiana, are documented in Emmanuel Vaughan-Lee's poignant short video. Viewers are asked to consider not only the plight of residents but also what...
National Geographic
Animal Habitats
Explore animal habitats and reinforce speaking, listening, reading comprehension, and writing skills with a unit that focuses on the Arctic, desert, ocean, prairie, and rainforest. Enthusiastic scientists read informational text to...
Curated OER
When Floating Ice Melts in the Sea
With this simple inquiry exercise young scientists observe the effects of melting ice on water level. Set up an easy experiment with floating ice cubes in a dish of water then have your pupils make and record their observations of the...
Curated OER
COASTAL EROSION
Students study the coastal erosion or the deposition by waves and sea level rise at a particular area.
Curated OER
Weather, Sea Level Rise and Climate Change Course
Students explain the impact of glacial melting to global climate change. In this environmental science instructional activity, students design an experiment to investigate the effect of salinity change to melting glaciers. They share...
Curated OER
Thermal Expansion and Sea Level Rise
Students conduct an experiment. In this water and sea level lesson, students conduct an experiment to see what happens to water levels when they are exposed to heat and discuss the effects of global warming on sea level.
Curated OER
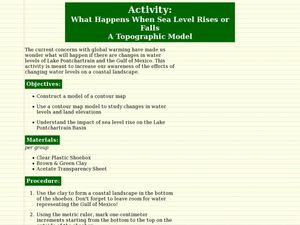
What Happens When Sea Level Rises or Falls
Students examine the impact of sea level on land formations. In this geography and map lesson plan, students construct a contour map model illustrating how much of the clay "coastline" is covered as water is added. Metric measurement...
Curated OER
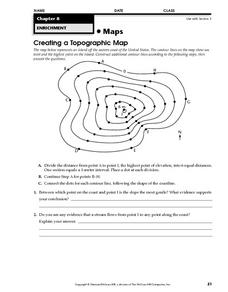
Creating a Topographic Map
In this topographic map worksheet, learners add contour lines to a topographic map using instructions provided. Once topographic map is finished, students complete 2 follow-up short answer questions.
Curated OER
Professor of Ice
In this environment experiment learning exercise, students complete 3 experiments using ice. First they label each experiment and respond to the four questions given. Then students do the 3 experiments as stated, considering what the...
Curated OER
Global Warming: Life in a Greenhouse
Students examine the evidence that scientists have used to support the existence of global warming and the greenhouse effect. How the concepts have been developed and evaluated form the focus of this lesson.
Curated OER
On the Rise . . . Sea Level and Global Warming
Ninth graders conduct an experiment to determine how melting sea ice affect sea level. In this earth science instructional activity, 9th graders explain the environmental consequences of rising sea level. They relate this instructional...


