Curated OER
Excel Lesson
Young scholars explore data and Excel spreadsheets. They collect data about political candidates. Students enter the data into a chart on Excel. They create a graph using the data and Excel.
Curated OER
Inserting Formulas in a Worksheet in Excel
Ninth graders study the vocabulary necessary to create formulas in Microsoft Excel. They complete assigned problems from the textbook for each type of function demonstrated by the teacher until they have developed competency with each...
Curated OER
Hemlock Trees and the Pesky Pest, The Woolly Adelgid
Pupils review Excel and how to create graphs with this program. They create two graphs in Excel, one showing the average number of woolly adelgid egg sacks on the outer 15 cm of hemlock branch at sites sorted by latitude, then one sorted...
Curated OER
Excel Lesson
Students investigate Microsoft excel. In this technology lesson, students create formulas using excel and apply these formulas to solve relative, absolute and mixed reference cells. They perform immediate and delayed calculations.
Curated OER
Fairy Tales
Sixth graders explore the elements of fairy tales. In this fairy tales lesson, 6th graders analyze several versions of Cinderella from around the world. Students graph fairy tale elements using Excel and create Venn diagrams comparing...
Curated OER
Skittle it Up
Students make a graph. In this graphing and Excel instructional activity, students work in groups and are given a bag of skittles. Students count the number of each color skittle and create a table in Excel. Students learn how to make a...
Curated OER
Piecewise Linear Functions and Excel
In this linear function activity, students use Excel worksheets to solve piecewise linear functions. They plot functions and produce piecewise linear functions. This six-page activity contains detailed instructions on how to use Excel...
Curated OER
Using Excel To Teach Probability And Graphing
Students engage in the use of technology to investigate the mathematical concepts of probability and graphing. They use the skills of predicting an outcome to come up with reasonable possibilities. Students also practice using a...
Curated OER
Basic Algebra and Computers: Spreadsheets, Charts, and Simple Line Graphs
Students, while in the computer lab, assess how to use Microsoft Excel as a "graphing calculator." They view visual representations of line graphs in a Cartesian plane while incorporating basic skills for using Excel productively.
Curated OER
Introducing Tessellations
Students create tessellations to increase their knowledge of the applications of geometry. They explore the different shapes of polygons.
Curated OER
Lemonade Business
Twelfth graders use all features of Microsoft Excel and Microsoft Power Point to create charts and graphs. They use charts and graphs to make a Power Point Presentation.
Curated OER
Using Spreadsheets and Graphs
Third graders explore mathematics by utilizing computers. In this graphing lesson, 3rd graders gather class data based on a particular topic such as the "favorite candy" of the class. Students utilize this information and computers to...
Curated OER
Creating Circle Graphs with Microsoft Excel
Students create graphs of circles. In this geometry lesson, students use Microsoft Excel to create graphs. They construct the graphs using paper and pencil as well as the computer.
Curated OER
Tracking Your Favorite Web Sites
Ninth graders track the hit count on their favorite web sites. In this Algebra I instructional activity, 9th graders record the number of hits on their favorite web site for twenty days. Students explore the data to determine...
Curated OER
Excel Turns Data Into Information
Pupils use excel to analyze data. In this technology lesson, students enter data into the excel program to find averages and organize data.
Curated OER
How to keep a timecard in Excel
Students fill out a timecard of family activities in Microsoft Excel. In this Excel lesson plan, students use the program to fill in times they do various activities with their families.
Alabama Learning Exchange
The State Capital of Stem and Leaf
Students explore the concept of stem and leaf plots. In this stem and leaf plots lesson, students plot the 50 US states' capitals on a stem and leaf plot according to the first letter of each state. Students compare...
Curated OER
Graphing
Pupils gather statistical information on a chosen topic and place it into a spreadsheet. Using th Excel chart wizard, students create tables, graphs and charts of their information. They interpret the data and share it with the class.
Curated OER
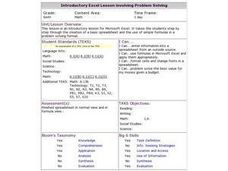
Introductory Excel Lesson involving Problem Solving
Sixth graders analyze an introductory lesson plan for Microsoft Excel. They go step by step through the creation of a basic spreadsheet and the use of simple formulas in a problem solving format.
Education World
A Spooky Adlib Story
Students navigate a simple spreadsheet and develop their creativity. They answer questions, filling in cells on Excel, using a template after filling in all the fields, a silly spooky story is created from the answers they give. Students...
Curated OER
Creating Your Own Web Site
Students explore and explain how to design Web pages complete with text, graphics, and hypertext links. After adding backgrounds, navigation buttons, and audio-visual effects, and revising their work based on comments from peers and...
Curated OER
Made Round To Go Round
In this instructional activity students investigate what it would cost to furnish one room of their choice by shopping on the Internet. Both Australian and American dollars are to be given for each item to demonstrate the difference...
Curated OER
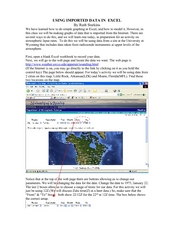
Using Imported Data in Excel
Learners import atmospheric data from the internet. In this earth science lesson, students graph the data they collected. They complete the worksheet after the activity.
Curated OER
Topic 6: Evaluating and Presenting Results
Students construct spreadsheets from raw data. In this spreadsheet construction instructional activity, students compile data into Microsoft Excel. Students familiarize themselves with entering and presenting data in a spreadsheet.


