Shodor Education Foundation
Shodor Interactivate: Plop It!
PlopIt allows users to build dot plots of data using the mouse. View how the mean, median, and mode change as entries are added to the plot.
Khan Academy
Khan Academy: Center and Spread Lesson
The resource from Khan Academy provides practice questions for the Praxis Core Math Test. This section reviews probability and statistics questions connected to the center and spread of data in a collection.
PBS
Pbs Learning Media: Central Tendency: Targeted Math Instruction
At the end of this instructional activity, students will be able to recognize and apply the concepts of mean, median, and mode in real-life problems.
Shodor Education Foundation
Shodor Interactivate: Misleading Graphs
This lesson will challenge young scholars to think creatively by having them design and build water balloon catchers from random scrap materials, while requiring them to take into consideration a multitude of variables including cost,...
Louisiana Department of Education
Louisiana Doe: Louisiana Believes: Eureka Math Parent Guide: Statistics
A guide to support parents as they work with their students with statistics.
E-learning for Kids
E Learning for Kids: Math: Olive Trees: Data & Chance
Ariel is taking a survey. Do you want to help her collect and describe data?
University of Wisconsin
University of Wisconsin: Measures of Central Tendency
This resource provides information about measures of central tendency.
Shodor Education Foundation
Shodor Interactivate: Lesson: Stem and Leaf Plots
Lesson plan introduces young scholars to stem-and-leaf plots. Many resources are available for student and teachers here.
Shodor Education Foundation
Shodor Interactivate: Dictionary: Median
This interactive dictionary page contains the definition of median with a description of how to find the median from a list of numbers. Be sure to follow the link to a discussion on mean, median and mode.
Primary Resources
Primary Resources: Mean, Median, Mode, and Range
Here are some teacher resources to aid in teaching mean, median, mode and range. Includes worksheets, games, and PowerPoint presentations.
Rice University
Hyper Stat Online Statistics Textbook: Summary of Measures of Central Tendency
Site discusses which method of central tendency is most appropriate for different purposes.
Other
James Wright: Measures of Central Tendency
This site looks at measures of central tendency and dispersion. Discussed are topics such as standard deviation, mean, median, and mode.
Houghton Mifflin Harcourt
Houghton Mifflin Harcourt: Saxon Activity Center: Graphing Calculator Activity: Positive and Negative [Pdf]
Order of operations with positive and negative numbers is the focus of this graphing calculator lesson. Included are detailed examples, demonstrations of key functions, and practice problems. Acrobat Reader required.
Houghton Mifflin Harcourt
Houghton Mifflin Harcourt: Saxon Activity Center: Graphing Calculator Activity: Average [Pdf]
A concise graphing calculator lesson on calculating average. Detailed examples, demonstrations of calculator functions, and practice problems included. Acrobat Reader required.
Sophia Learning
Sophia: Finding Mean, Median, and Mode: Lesson 5
This lesson will demonstrate how to find the mean, median, and mode for a set of data. It is 5 of 5 in the series titled "Finding Mean, Median, and Mode."
Sophia Learning
Sophia: Mode: Lesson 6
This lesson defines the term mode. It is 6 of 14 in the series titled "Mode."
Sophia Learning
Sophia: Using Different Measures of Central Tendency: Lesson 3
This lesson demonstrates how the different measures of central tendency can cause you to look at data differently. It is 3 of 5 in the series titled "Using Different Measures of Central Tendency."
Sophia Learning
Sophia: Unimodal vs. Bimodal Distribution: Lesson 2
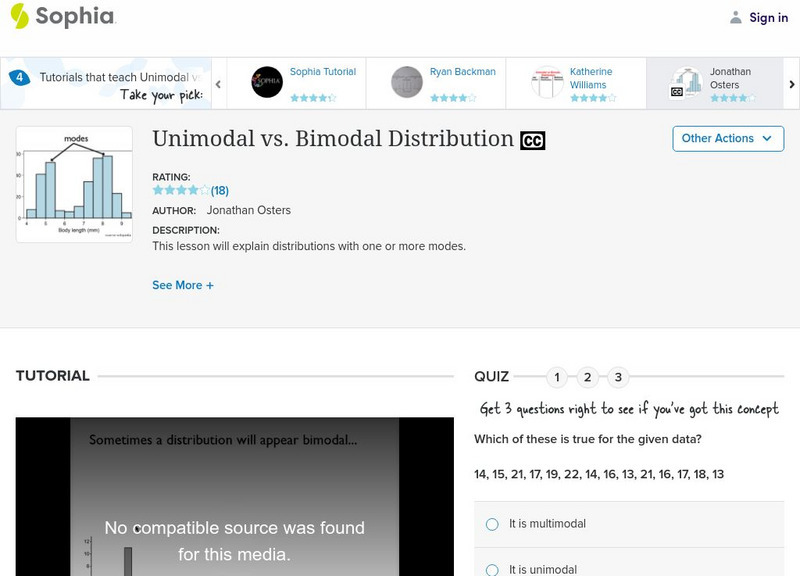
This lesson will explain distributions with one or more modes. It is 2 of 3 in the series titled "Unimodal vs. Bimodal Distribution."
Sophia Learning
Sophia: Using Different Measures of Central Tendency: Lesson 4
This lesson demonstrates how the different measures of central tendency can cause you to look at data differently. It is 4 of 5 in the series titled "Using Different Measures of Central Tendency."
ClassFlow
Class Flow: Statistics Landmarks Vote
[Free Registration/Login Required] This lesson uses clustering to explore the concept of mean, median, and mode of a set of data and calculates the arithmetic mean.
Free Math Help
Free Math Help: Mode
Students learn how to find the mode of a dataset. The tutorial consists of a definition and examples with detailed solutions.
Other
Architectural Acoustics and Lighting: Room Acoustics
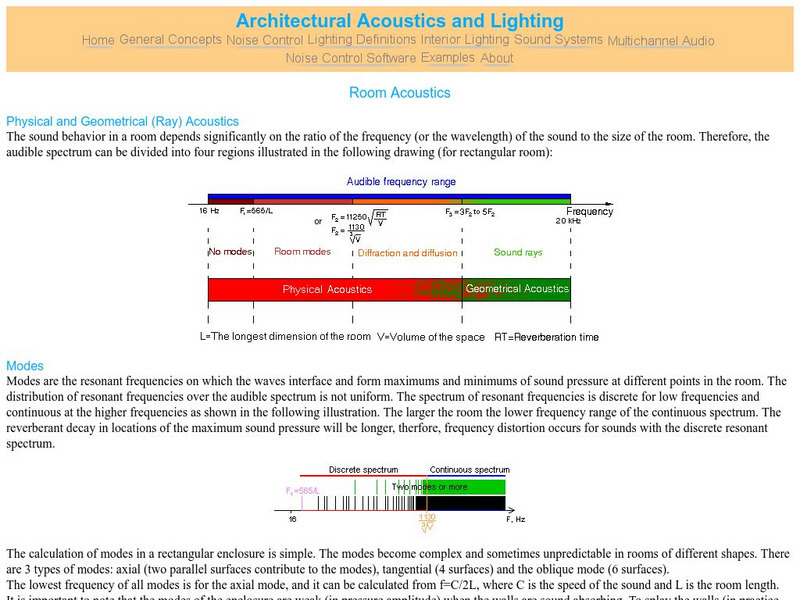
This site from Architectural Acoustics and Lighting provides a discussion of various factors affecting the acoustics of a given room. Room dimensions, the wavelength of the sound wave, the physical characteristics of the walls, the...
Rice University
Hyper Stat Online Statistics Textbook: Mode
This site, written by a statistics professor at Rice University, gives a definition of mode and discusses the advantages of using mode as a measure of central tendency.
Varsity Tutors
Varsity Tutors: Hotmath: Algebra Review: Mode, Mean and Median
Find a quick, concise explanation of a mode. An example is given and clearly explained. Mean and median are also explained.


