Flipped Math
Calculus AB/BC Mid-Unit 1 Review: Limits
Limit the amount one forgets about limits. A mid-unit review lesson has individuals complete a worksheet of problems on limits. They go over the meaning of limits, evaluate limits algebraically, use graphs and tables to find limits, and...
Flipped Math
Calculus AB/BC - Connecting Multiple Representations of Limits
It's time to put it all together. Viewers of an informative video learn to connect multiple representations of limits. Given algebraic, tabular, and graphical representations of a linear piecewise function, they determine whether a limit...
Flipped Math
Calculus AB/BC - Estimating Limit Values from Tables
There's value in using a video to analyze a table of values. Pupils learn how to find the limit of a function from a table of values in the fourth of 18 lessons in Unit 1 - Limits and Continuity. An engaging video gives a tutorial on how...
Radford University
Pizza, Pizza!
Ponder the problem of pizza prices. Pupils use provided information about two different pricing schedules for pizza. They create tables of values and functions to represent the pricing schemes, consider domain restrictions, and identify...
CCSS Math Activities
Smarter Balanced Sample Items: 8th Grade Math – Target F
Functions model relationships between quantities. The Smarter Balanced sample items demonstrate the assessment strategies for eighth grade function modeling standards. Items range from constructing linear functions from a table and a...
Kenan Fellows
Man vs. Beast: Approximating Derivatives using Human and Animal Movement
What does dropping a ball look like as a graph? An engaging activity asks learners to record a video of dropping a ball and uploading the video to software for analysis. They compare the position of the ball to time and calculate the...
CK-12 Foundation
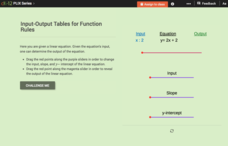
Input-Output Tables for Function Rules
Make the abstract a bit more concrete with an interactive that asks learners to slide an input value through a function to determine the output. Changing the slope and y-intercept allows them to see the how the output values change.
CK-12 Foundation
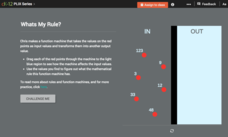
Function Rules for Input-Output Tables: Whats My Rule?
What's the rule that makes it true? A virtual function machine generates output values as learners submit the input values. Their job is to analyze the inputs and outputs for a pattern and write a function rule.
CK-12 Foundation
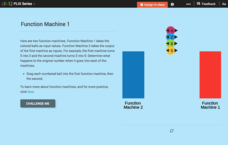
Function Rules for Input-Output Tables: Function Machine 1
Challenge your classes to find the pattern of a double function machine. After recording the outputs of both machines, learners identify the pattern and the corresponding function. Both patterns involve adding/subtracting a constant.
CK-12 Foundation
Function Rules for Input-Output Tables: Function Machine!
Watch as a function machine converts an input to an output. Learners determine the work applied by the function machine to write a function rule. Questions accompany the function machine animation to guide individuals to conclusions.
CK-12 Foundation
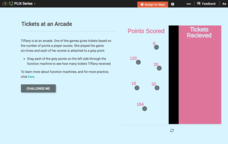
Function Rules for Input-Output Tables: Tickets at an Arcade
This is the ticket to learning about function rules! Using online manipulatives, scholars build a table of values and then answer questions about the related function. They examine the relationship between the input and output values and...
CK-12 Foundation
Function Rules for Input-Output Tables: Soda Sugar Function Table
Examine the relationship between the input and output variables in a table of values. As learners build an input-output table using online manipulatives, they begin to identify patterns. They answer questions about these patterns...
EngageNY
Comparing Linear Functions and Graphs
How can you compare linear functions? The seventh installment of a 12-part module teaches learners how to compare linear functions whose representations are given in different ways. They use real-world functions and interpret features in...
West Contra Costa Unified School District
Quadratic Equations — What We Know
Everything you could possibly want to know about quadratic equations, all in one resource. Instructors demonstrate how to translate between different forms of quadratics (equation, table of values, graph, verbal description) and finding...
West Contra Costa Unified School District
Multiple Representations of Equations
class members first work through finding the equation, table of values, graph, and key features of a linear function expressed verbally. Individuals then work through several more problems given different representations.
Mathematics Assessment Project
Sorting Functions
There's no sorting hat here. A high school assessment task prompts learners to analyze different types of functions. They investigate graphs, equations, tables, and verbal rules for four different functions.
Curated OER
Graphs and Functions
Middle schoolers describe plotting functions on the Cartesian coordinate plane. They solve functions on paper and using an online tool to plot points on a Cartesian coordinate plane creating lines and parabolas.
CCSS Math Activities
Smarter Balanced Sample Items: 8th Grade Math – Target C
Target C from the Smarter Balanced assessment for eighth grade is understanding the connections between proportional relationships, lines, and linear equations. A slide show includes items about graphing proportional relationships and...
Curated OER
Identify and Graph Linear Equations
Students investigate linear functions. In this mathematics activity, students plot points onto a graph by solving the equations y=x and y=mx+b by being given numbers for x and solving for y.
Curated OER
Graphing Linear Functions Two
Use this graphing linear functions worksheet to have learners graph three linear equations. They use a table of values, the intercept method, and slope-intercept form to graph three functions.
Curated OER
Graphing Linear Functions
In this linear functions worksheet, students graph 3 linear functions. Students graph each function by making a table of values given a linear function in standard form.
Curated OER
Direct Variation
In this direct variation learning exercise, students answer 4 multiple choice questions that involve identifying a direct and constant variation and writing the direct variation equation.
Texas Education Agency
Texas Gateway: Making Predictions and Critical Judgments (Table/verbal)
Given verbal descriptions and tables that represent problem situations, the student will make predictions for real-world problems.
Other
Algebra Class: Solving and Graphing a Quadratic Equation
Math teacher provides a unit on quadratic equations in which she explains the concepts of solving and graphing quadratic equations through numerous examples and graphs. Hyperlinks are available to each step that ultimately leads to...


