Curated OER
Collect and Organize Data
In this data analysis learning exercise, 4th graders use a tally chart about favorite television programs. They record which are least or most popular, rankings, and combinations of programs.
Curated OER
Make a Tally
In this tally chart activity, learners read the word problems and use the information within the problem to make a tally chart. Students use the tally charts to help them finish and solve the word problem.
Curated OER
Collect and Organize Data: Homework
For this collecting and organizing data worksheet, students use the tally chart for the students' eye color to answer the first two questions. Students then survey their family for eye color, record those results in a tally chart, and...
Curated OER
Read a Pictograph
In this data display worksheet, learners solve 4 problems in which data on a tally chart and pictograph are analyzed. Students use this information to solve the problems.
Curated OER
Histograms: Practice
In this histograms worksheet, students use the bar graph histogram to answer questions 1-4 and the tally chart for question 5. Students finish with two test prep questions.
Curated OER
Collect and Organize Data: Reteach
In this data collection worksheet, students learn the parts of a tally chart and how it organizes information. Students then use the second tally chart to help them answer the six questions.
Curated OER
Favorite Pets
In this tally chart worksheet, students finish filling in a chart involving a survey of favorite pets from a particular class. Students then answer 4 short answer questions about the results of the survey.
Curated OER
Reading Frequency Tables
In this data interpretation instructional activity, students record the data from 10 examples into frequency tables. They group 10 more data sets, and make a frequency table for each.
Curated OER
Tally Marks
In this tally chart worksheet, 1st graders use tally marks to count. Students count the number of stars in each row, keeping a running tally beside each grouping.
Curated OER
Tally Marks
In this tally chart worksheet, 1st graders use tally marks to count. Students count the number of pumpkins in each row, keeping a running tally beside each grouping.
Curated OER
Tally Chart
In this tally chart learning exercise, 1st graders use tally marks to count. Students count the number of snowmen in each row, keeping a running tally beside each grouping.
Curated OER
Tally Chart-
In this tally chart worksheet, 1st graders use tally marks to count. Students count the number of dinosaurs in each row, keeping a running tally beside each grouping.
Curated OER
Dinosaur Tally
In this counting worksheet, students count the number of dinosaurs pictured in 6 examples. They use tally marks to show how many objects are in each box.
Curated OER
Thanksgiving Math
In this Thanksgiving theme math practice, students count turkeys and tally. In this fill in the blank activity, students find three answers.
Curated OER
Favourite Colours
In this colors instructional activity, students survey 20 people on what their favorite color is. They mark the results using tallies. Students then take their data and put the totals in a frequency table.
Curated OER
Chances And Tallying
In this graphing worksheet, 2nd graders use tally marks for a coin toss. Students respond to 5 questions about their chart and outcomes.
Curated OER
Creating Frequency Tables
In this frequency table instructional activity, students explore a given set of numbers. They group the data and create a frequency table. This one-page instructional activity contains ten problems.
Curated OER
Organizing and Interpreting Data
In this organizing and interpreting data activity, learners solve and complete 10 different problems related to reading various data tables. First, they complete the 3 charts shown with the correct tally amount, frequency amount, and...
Curated OER
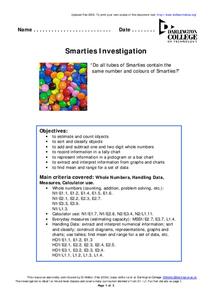
Smarties Investigation
In this math worksheet, students participate in an investigation of Smarties candy. For example, students estimate how many candies they have in each color, count the actual number, and record the information in a tally chart.
Curated OER
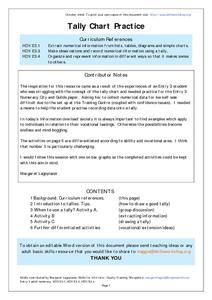
Tally Chart Practice
In this tally chart activity, students will read about tally charts and their uses. Students will make a list of when and why they could make a tally chart. Next students will complete a tally chart and write statements about the...
Curated OER
Smarties Investigation
In this math worksheet, students complete a variety of activities using Smarties candy. For example, students estimate the number of each color, count the actual amount, and record their results in a tally chart.
Curated OER
Tally Charts
In this math worksheet, students complete 4 tally charts. Students use a list of information, such as colors or types of fruit, to create the charts.
Curated OER
Family Size
In this family size activity, students complete a tally chart to determine data from a family size line plot. They organize the data in the chart to determine the mean, median, mode, and range of the data. There are six problems in...
Curated OER
Did You Eat That! - Food Graph
In this health and diet instructional activity, students ask ten of their friends what their favorite vegetables are. Then they tally their votes and shade them in on the graph provided.


