Flipped Math
Unit 12 Review: Probability and Normal Distributions
It's time to assess probability knowledge. Individuals complete a set of problems to review concepts from the unit. They identify outcomes and sample spaces, determine compound and conditional probabilities, and investigate situations...
US Department of Commerce
The New Normal
Don't be normal ... be exceptional in understanding statistics. Pupils analyze six different sets of census data using histograms or normal probability plots to determine whether each data set fits a normal distribution. They then get...
US Department of Commerce
Over the Hill - Aging on a Normal Curve
Nobody is too old to learn something new. Young statisticians analyze census data on the percentage of the population older than 65 years old in US counties. They fit a normal distribution to the data, determine the mean and standard...
Radford University
Survey Activity
It's time to take a survey. After looking at an example of a survey on lunch preferences, groups design their own surveys. They consider the sample size and sampling technique, then conduct the surveys. As a final activity, they create...
Radford University
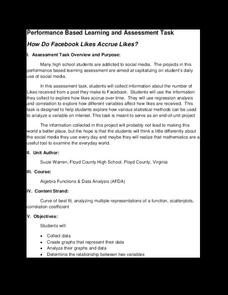
How Do Facebook Likes Accrue Likes?
Finally, a project pupils will instantly like! Young mathematicians collect data on the number of likes they receive for a social media post over time. During the first part of the project, they determine a curve of best fit and...
Radford University
Is Fall Normal?
Fine the normality of fall measurements. Pairs collect measurements of fall leaves and one other fall object. Using the measurements, the groups determine the descriptive statistics for the object and using the Empirical Rule, figure out...
Radford University
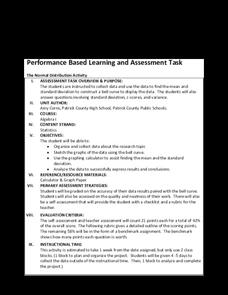
The Normal Distribution Activity
For whom does the bell fit? Pupils begin by working in groups gather data on three different variables. They then determine the mean and standard deviation of each data set and create bell curves. To finish, they answer guiding questions...
Radford University
Are We Normal?
Develop a sense of normal. Learners develop two questions to ask classmates to gather numerical data before creating a box and whisker plot and a histogram to display their data. Class members make inferences and investigate the data...
Radford University
How Normal Are You?
It's completely normal to learn about normal distributions. An engaging lesson has young statisticians collect and analyze data about their classmates as well as players on the school's football team. They determine whether each set of...
Radford University
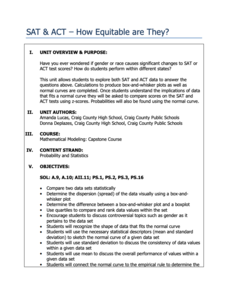
SAT and ACT – How Equitable Are They?
Test the test takers' knowledge of statistics about data from the SAT and ACT tests. Future collegians explore the idea of gender and racial bias in high-stakes college admissions exams. They analyze historical data on average scores by...
Radford University
Let's Buy a Car
Ready to buy a car? Learners research different makes and models of cars to decide on the best one to buy. They collect data on cost, fuel efficiency, safety ratings, and insurance costs, then create and analyze data displays to make...
Radford University
What Is Normal?
Are you taller than a Major League Baseball player? Future mathematicians learn about normal distributions, percentiles, z-scores, and areas under a normal curve. They use the concepts to analyze height data of Major League Baseball...
Radford University
Are Kitchen Cabinets at the Correct Height? Lesson 6
Don't hit your head on the kitchen cabinet. Using previously collected female height data, scholars apply confidence intervals and tests of significance to perform a data analysis. They connect the data to the height
of kitchen cabinets...
Radford University
Are Kitchen Cabinets at the Correct Height? Lessons 1-5
Here's a not-so-normal unit on normal heights. Future statisticians anonymously collect class data on female heights, weights, and shoe sizes. They then analyze the data using normal distributions, z-scores, percentiles, and the...
Radford University
Big Future - How SAT Scores Play a Role in College Acceptance
Understanding the importance of SAT scores is as easy as ABC. A set of three statistics lessons teaches scholars about normal distributions, the Empirical Rule, and z-scores. They apply their newfound knowledge to investigate data...
Rice University
Introductory Statistics
Statistically speaking, the content covers several grades. Featuring all of the statistics typically covered in a college-level Statistics course, the expansive content spans from sixth grade on up to high school. Material...
College Board
2004 AP® Statistics Free-Response Questions Form B
Over the years, data analysis has been important. Looking back to the 2004 AP® Statistics Form B free-response questions, pupils and teachers see the importance of analysis of data sets. The six questions contain analysis of data on...
College Board
2005 AP® Statistics Free-Response Questions Form B
Here's another great way to learn from the past. Released free-response questions provide a look into how concepts measured on the 2005 AP® Statistics Exam on Form B. Teachers and pupils review questions that cover concepts such as...
College Board
2007 AP® Statistics Free-Response Questions Form B
So that is how they do it! Pupils and teachers see how College Board assesses topics using the free-response questions from Form B of the 2007 AP® Statistics test. The six questions are divided in two sections, the first five being...
College Board
2008 AP® Statistics Free-Response Questions Form B
To know what is on the test would be great. The six free-response question from the second form of the 2008 AP® Statistics gives pupils an insight into the format and general content of the exam. Each question requires the test...
College Board
2006 AP® Statistics Free-Response Questions Form B
Test a significant review of statistical questions. The resource provides pupils and teachers with insight into the way the exam assesses statistical concepts. Half of the released questions from the 2006 AP® Statistics Form B...
College Board
1999 AP® Statistics Free-Response Questions
Closer to 2010 than expected. Several of the 1999 AP® Statistics free-response questions align to Common Core standards. Items ask pupils to analyze residuals, two-way tables, and calculate expected values to determine the fairness...
College Board
2000 AP® Statistics Free-Response Questions
A little communication goes a long way. Free-response questions from the 2000 AP® Statistics exam require pupils to communicate their results—not just perform calculations. The questions ask individuals to explain, discuss, and interpret...
College Board
2002 AP® Statistics Free-Response Questions
Statistically, prepared classes perform better. Teachers and pupils use the released 2002 AP® Statistics Free-Response questions to gain an understanding of how questions may be worded on the exam. Resources request that teachers put an...


