Curated OER
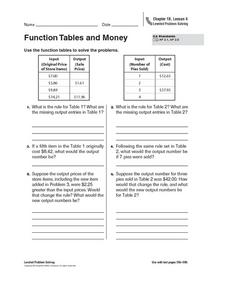
Function Tables and Money
In this function tables, money learning exercise, students examine 2 different function tables, where they are given input information. Students determine the rule of the function table, then calculate the missing output values. The...
Curated OER
Penny Lab
In this percent composition worksheet, students carry out an experiment to determine the percent of zinc in a penny. They write a balanced equation for the chemical reaction they performed with the penny and hydrochloric acid.
Curated OER
Solutions
In this solutions instructional activity, students solve twelve problems including calculating products made in reactions, determining limiting reagents, calculating molarity of solutions, determining percent composition, and finding...
Curated OER
Problem-Solving Application: Make a Circle Graph
In this circle graphs worksheet, students analyze a data table about the activities in a day. Students then use this data to make a circle graph. Students answer 6 questions about the graph.
Curated OER
Thinking About Technology: What Is It? How Can It Help Us?
What is technology and how can it help us? Using a worksheet, students read a list and choose practical applications of scientific knowledge, brainstorm examples of home, school and hospital technology, graph answers in a pie chart, and...
Curated OER
Bits and Pieces - More About Percents - Online Manipulatives
In this online percentages worksheet, students access the Library of Virtual Manipulatives web site and open the percentage tool. They use the online tool to complete 8 multi-step questions making graphical representations and finding...
Curated OER
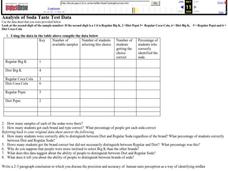
Analysis of Soda Taste Test Data
In this analysis instructional activity, students are given the raw date from a soda taste test experiment. Students use that data to complete a graphic organizer and to answer 8 questions.
Curated OER
Percentages Introduction
In this percentages worksheet, students color 25% of 100 small squares blue, 35% red and 30% yellow. Students figure out how many squares they have left and then what percent of the 100 squares are left. Students then work out 5...
Curated OER
Matrices
In this matrices activity, 9th graders solve and complete 11 different problems that include interpreting various matrices shown. First, they determine the operations that would result in the matrix illustrated. Then, students find the...
Curated OER
Math--Fractions and Percentages
In this fractions and percentages worksheet, learners write down the percentages of a pie chart and change then into fractions. Students change 7 fraction sentences into a percentage sentence.
Curated OER
Pies and Percentages--Learning About Pie Graphs
In this pie graph instructional activity, students draw a pie graph for the zookeeper with the data he collected, choose a different color for each animal species and make a key to the graph.
Curated OER
Slopes for the Mathematically Inclined
In this slope activity, 9th graders solve and complete 6 different problems that include completing charts and applying applications to the real world. First, they use the pictures shown to measure the riser and tread of 3 consecutive...
Curated OER
Proportional Reasoning: Ratio Applications
For this ratio applications worksheet, 8th graders solve and complete 24 various types of problems that include proportional reasoning. First, they solve each pair of similar figures for the given variable. Then, students write and solve...
Curated OER
6th Grade Math Worksheet
In this multiple task math worksheet, 6th graders solve 10 math problems involving metric units, number lines, composite numbers, estimation and percentages.
Curated OER
Data Management and Probability: Applications
In this data management and probability applications activity, 7th graders solve 13 different types of problems that include finding the mean, median, mode, and range of each set of values, as well as, solving a number of word problems....
Curated OER
Ratios, Rates and Percentages
For this ratios, rates and percentages worksheet, 6th graders solve 16 different types of problems that include writing each ratio as a decimal and a fraction in lowest terms as a percent. They also arrange numbers in ascending order and...
Curated OER
Decimals, Percent and Scientific Notation
In this decimals, percent and scientific notation worksheet, 9th graders solve various types of problems that range from shading an indicated part of a shape to calculating using scientific notation to express their answer. They express...
Curated OER
Ratio, Rates and Percentages
In this ratio, rates and percentages worksheet, 8th graders solve 22 various types of problems related to ratios, rates and percentages. They first write ratios in lowest terms and describe each of comparison stated. Students also solve...
Curated OER
Decimals and Percents
In this decimals and percents activity, 8th graders solve 26 different types of problems that include expressing numbers as a decimal and a percent. Then they change each number to fractions and determine the unknown number for each...
Math Mammoth
Mental Math in Percent Problems
In this math worksheet, students are given 21 percentage problems which they are to work out mentally. There are story problems, tables and simple conversion.
Math Mammoth
Percent Fact Sheet
In this math worksheet, students are given 9 percentage problems that involve conversion, variables, story problems and fractions.
Math Mammoth
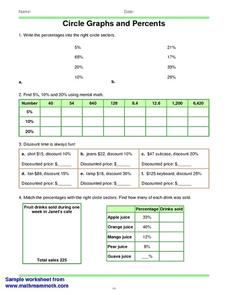
Circles Graphs and Percents
In this percent instructional activity, students read and interpret circle graphs. They determine discounts, and match percentages with circle sectors. This one-page instructional activity contains approximately 30 problems.
Curated OER
Car Activities
For this math worksheet, students find cars in Auto Trader. They find the difference between the prices of the cheapest and most expensive cars. Students select a car they like and follow directions to buy on credit. Students complete a...
Curated OER
Finding the Percent of a Number
In this mathematics worksheet, 6th graders find the percents of various numbers. They set up the problem, estimate, and write their response. Students also compare their answers to their estimates for each problem.


