Illustrative Mathematics
Overlapping Squares
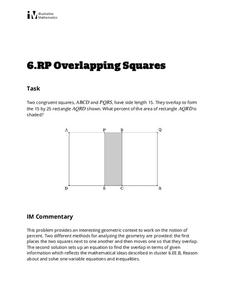
The objective of this activity is to find the percent of the area of a two squares overlapping. Mathematicians find the ratio of area for the part that overlaps to the rectangle formed. The final answer is a percent as a rate per 100....
Illustrative Mathematics
Dana's House
Your class is to find the percent of the lot that is not covered by a house. Make sure your pupils understand the problems before they begin. The lot is the whole of the percent problem and the house is the part. The exercise is good...
Illustrative Mathematics
Gotham City Taxis
Taxi! Have your travelers figure out how far they can go in a taxi for $10.00. They must account for the mileage rate and tip in their calculation. They can set up a table or make an equation to solve for the exact mileage they can...
Illustrative Mathematics
The Price of Bread
As part of an initiative to strengthen our young adults' financial understanding, this problem explores the cost of bread and minimum wage since the 1930s. Learners are asked to find the percent increase from each year and compare it...
Illustrative Mathematics
Chess Club
When the membership in a chess club changes, it is your mathematicians' job to find out how many boys and girls are attending and the percent change from last year. The activity provides a great compound problem finding the different...
Illustrative Mathematics
Comparing Years
Who knew that the Egyptian, Julian, and Gregorian year were different lengths? Your mathematicians will! They will have to calculate the difference between the years in seconds and find the percent change. Using dimensional analysis,...
Illustrative Mathematics
Selling Computers
A quick activity to test your learners' knowledge of percent increase. When an electronic store needs a 30% increase in computer sales, your mathematicians must calculate how many computers they need to sell next month.
Illustrative Mathematics
Shirt Sale
Everyone loves a good deal, and your mathematician's job is to calculate the original price when given the discount. A different type of problem than the traditional "find the percent change" has your learners working backwards to...
Illustrative Mathematics
Sharing Prize Money
When three classrooms are to split up prize money, your mathematicians must find the percentage that each class deserves and calculate the total amount. There is an option to use a calculator and practice rounding.
Illustrative Mathematics
Sale!
Everyone loves a sale, and this worksheet allows learners to calculate which sale is more rewarding. The activity can be adapted for different thinking contexts. The answer key describes different answer choices, some being higher...
National Research Center for Career and Technical Education
Business Management and Administration: Compound Interest - A Millionaire's Best Friend
Many math concepts are covered through this resource: percentages, decimals, ratios, exponential functions, graphing, rounding, order of operations, estimation, and solving equations. Colorful worksheets and a link to a Google search for...
National Research Center for Career and Technical Education
Hospitality and Tourism 2: Costing
The lesson plan provides a richly detailed narrative and sample problems for teaching or reinforcing how to work with percentages. In particular, your audience will compute the costs per serving of food and simulate setting menu prices...
Curated OER
Birds, Fractions and Percentages
Students study fractions, percentages, spreadsheets, and computers by watching and recording the number of species of birdsseen. They create a spreadsheet to record the results of their one month study.
Curated OER
Discount and Sales Price
One of the most practical ways to teach about percentages is to use the real-life example of "sale" or "discount" pricing. This presentation poses many of these type of problems for young mathematicians who are trying to master the...
Curated OER
Fractions, Decimals, and Percentages
Here is a challenging and educationally sound presentation on how to convert between fractions, decimals, and percents. Youngsters are given many opportunities to make these conversions, and receive good coaching in the teaching slides....
Curated OER
Percentages
A helpful presentation that demonstrates the similarities between fractions and percentages Learners are first shown a grid of 100 squares that has a certain amount shaded in. They are taught how to assign both a fractional value and a...
Curated OER
Markup and Discount
Seventh graders observe and demonstrate how to calculate markups and discounts including markup percentages and discount percentages. They observe a teacher-led demonstration, then in pairs read scenarios and independently complete...
Curated OER
Finding Percentages
Here is an approach to calculating percent with 16 practice problems to solidify the skill. Two examples demonstrate dividing by 100 to get one percent and then multiplying by the percentage in question to get the solution. Learners find...
Curated OER
Linear Equations
Eighth and ninth graders solve and graph 42 different problems that include writing various equations and graphing them on a grid. First, they create a table for each equation and graph it on a grid locating the x-and y-intercepts. Then,...
Curated OER
Empirical Formula
Plenty of time was invested in creating this detailed presentation. The first slide alone includes several steps that support your explanation of percent composition, a precursor to understanding how to write empirical and molecular...
Curated OER
Using Percentage in Compound Composition
In this percent composition worksheet, students find the percent of each type of atom in a compound, they find the total mass of a sample and they determine the mass of particular atoms in a compound.
Curated OER
Comparing Apples With Apples 1
Elementary schoolers observe and demonstrate how to add and subtract fractions with like denominators. They observe the teacher model a variety of fraction addition and subtraction problems and use fraction strips to complete a worksheet.
Curated OER
Probability and the U.S. Map
Learners solve and complete 20 different problems that include using a U.S. map and data table. First, they calculate the probability that they will select a state that begins with each letter of the alphabet. Then, everyone completes...
Curated OER
What's in a Number? Analyzing Smoking Statistics
Sixth and seventh graders analyze smoking statistics. In this health lesson, learners look at the percentage of people who smoke from each race group. They create a bar graph and circle graph that displays this information.


