Curated OER
Reading the Neighborhood
First graders complete activities with the story One Monday Morning in the Macmillan/McGraw Hill Textbook. In this data lesson, 1st graders read the story and gather data to create a picture graph. They read the graph and answer...
Curated OER
Statistics Problems
In this statistics learning exercise, 3rd graders answer questions about different graphs including bar graphs, picture graphs, line graphs, and more. Students complete 20 multiple choice questions.
Curated OER
Birthday Graph
Students explore graphs. In this graphing math lesson plan, students record the birthdays of each classmate on a data table. Students cut out and add a picture of a birthday cake to a floor or wall pictograph representing the...
Curated OER
Ice Cream Pictograph
Students create a graph. In this pictograph lesson, students cut out 20 small ice cream cones and decorate them. Students create a pictograph with their ice cream cones.
Curated OER
Usage and Interpretation of Graphs
Students explore graphing. For this graphing lesson, students predict how many shoe eyelets are present in the classroom. Students count eyelets and work in groups to organize and chart the data collected. Students put all the data...
Alabama Learning Exchange
Tiger Math Graphing
Learners practice various skills using the book Tiger Math: Learning to Graph from a Baby Tiger. After listening to the story, they create a pictograph using data collected from the text. They also color a picture of a tiger,...
Curated OER
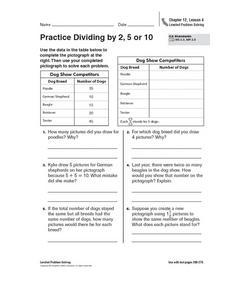
Practice Dividing by 2, 5, or 10
In this pictograph problem solving worksheet, students analyze the data on a table and create a pictograph. Students read and solve 6 story problems about the pictograph.
Curated OER
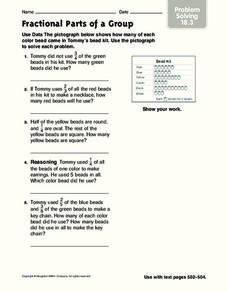
Fractional Parts of a Group
In this problem solving worksheet, students problems solve the answers to 5 mathematical word problems involving fractional parts. Students use data from a pictograph to assist them in solving each word problem.
Curated OER
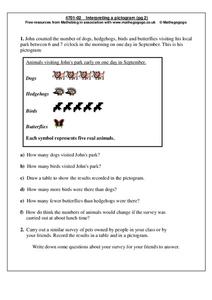
Interpreting a Pictogram
In this pictogram instructional activity, students read and analyze a pictogram about dogs, hedgehogs, birds and butterflies and then answer 6 short answer questions. Students conduct a similar survey on pets owned by their friends and...
Curated OER
Make a Graph
In this graphing activity, 1st graders use given data to create a graph and answer questions. In this problem solving activity, students solve five problems.
Curated OER
Using a Pictograph
In this problem solving worksheet, 5th graders answer four questions using the pictograph provided. The worksheet pertains to sports.
Curated OER
Make a Pictograph
In this pictograph learning exercise, 2nd graders create a pictograph involving colors they see the most often in clothing, recording marks and placing those marks in three boxes labeled red, blue and green. Students cut out squares for...
Curated OER
Favorite Pet
In this math worksheet, 2nd graders study the pictograph of favorite pets. Students then answer nine questions pertaining to the given graph.
Curated OER
Tally Chart/Pictograph
In this graphic organizer worksheet, students can record their own data on this tally chart/pictograph. There are two columns and six rows with room for a title.
Curated OER
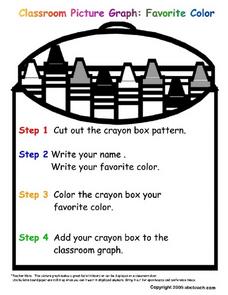
Classroom Picture Graph: Favorite Color
In this picture graph worksheet, 1st graders will cut out a crayon box pattern and write their name and favorite color on it. Then they will color it their favorite color and add to the classroom graph.
Curated OER
THE EASTER BUNNY GETS READY! PICTURE GRAPH
In this graphing worksheet, students read a picture graph about colors of Easter eggs and then answer questions about the graph.
Curated OER
Going Bananas: Addition and Graphing
In this addition worksheet, 1st graders will look at a picture to add the total number of bananas a monkey eats per day for five daily sums. Then students will answer four short word problems which require students to view the data as a...
Curated OER
Creating Stories Using Pictographs
Fourth graders research pictograph stories written by Native Americans. They investigate the history behind pictographs, and look through a reference book identifying the different pictures. The teacher then create their own individual...
Curated OER
Take an Ant to Lunch
Second graders construct a model of an ant, exemplifying that ants are insects. Students gather data create a pictograph chart to show ant food preferences. Also, 2nd graders access the Internet to explore ant eating habits.
Curated OER
Fruit Loop Graphing
Fifth graders interpret data and create graphs. Given Fruit Loops, they sort and classify according to color. Using spreadsheet technology, 5th graders record their data and create bar and circle graphs. Students analyze data and...
Curated OER
One, Two, Three...and They're Off
Students make origami frogs to race. After the race they measure the distance raced, collect the data, enter it into a chart. They then find the mean, median, and mode of the data. Next, students enter this data into Excel at which time...
Curated OER
M&M Graphing and Probability
Students sort, classify, and graph M & M's. They create pictographs and bar graphs with the colors and numbers in each bag of M & M's. They calculate the ratio and probability based on class results.
Curated OER
Picture Fists Full of Kisses
Ease children's back-to-school jitters with this primary grade lesson based on the book The Kissing Hand by Ruth E. Harper. Starting off with a singing of the song "I Wish I Had a Little Red Box", children go on to discuss and...
Curated OER
Hollywood's Top Ten
Students gather data on top 10 highest grossing movies, and make a bar graph and a pictogram.


