Teachnology
Teachnology: Survey Teaching Theme
Survey Theme provides an excellent collection of free sample worksheets, teacher resources, lesson plans and interactive media for grades k-12.
Teachnology
Teachnology: Survey Teaching Theme
Survey Theme provides an excellent collection of free sample worksheets, teacher resources, lesson plans and interactive media for grades k-12.
Government of Alberta
Learn Alberta: Math Interactives: Exploring Election Data
Using actual Alberta provincial election results, students have the opportunity to interpret election data using a variety of graph types. Pictographs, line graphs, bar graphs, circle graphs, and data tables are covered in this...
Alabama Learning Exchange
Alex: Great Golly Graphs
This lesson plan asks learners to create a survey project including graphs, questions, tables, and data analysis. It gives an assessment and ideas for remediation and extension as well as ways to manage behavior problems and reluctant...
Primary Resources
Primary Resources: Tally and Bar Charts
Lots of good materials for teaching about tally marks and bar graphs.
Beacon Learning Center
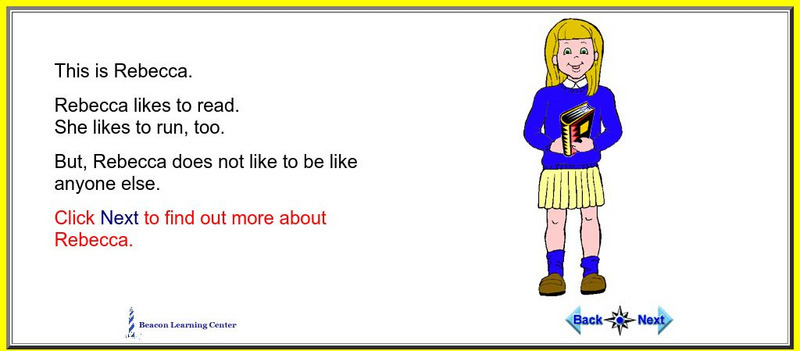
Beacon Learning Center: I Am Special
An interactive web lesson introduces students to picture graphs. It also allows them to practice creating and interpreting the graphs.
Beacon Learning Center
Beacon Learning Center: I Am Special
The activity investigates picture graphs. Learn about Rebecca through picture graphs.
Beacon Learning Center
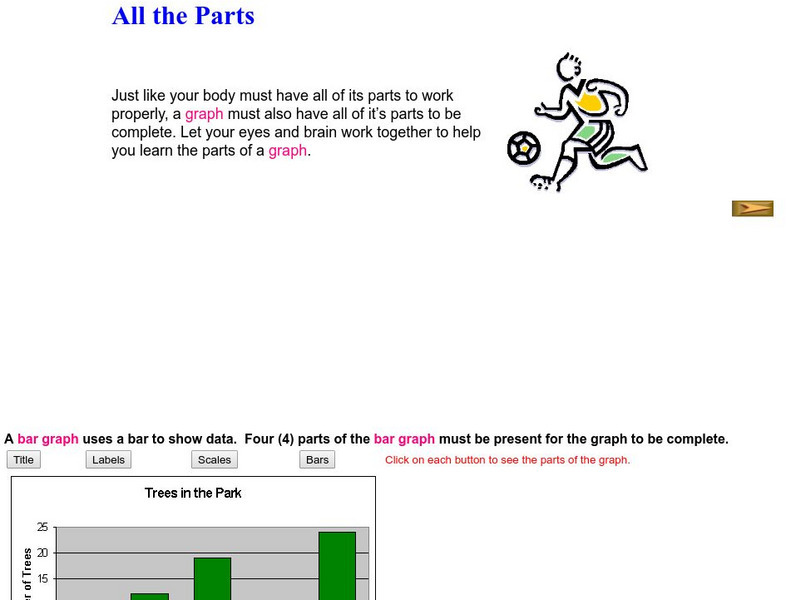
Beacon Learning Center: All the Parts
The activity investigates bar graphs. Students learn about all the parts of a graph.
Beacon Learning Center
Beacon Learning Center: Play Ball
An interactive web lesson shows examples of pictographs and challenges students to answer questions about the graphs.
Scholastic
Scholastic: Study Jams! Math: Data Analysis: Pictograph
Watch short video clips that show step by step how to organize data and create a pictograph. Then check for understanding by testing yourself.
Mangahigh
Mangahigh: Data: Use and Interpret Pictographs
This site provides students practice with the concept of pictographs. Students can learn about the topic by completing an interactive tutorial. Students can then take a ten question timed test to practice the skill.
Math Is Fun
Math Is Fun: Pictographs
Explains, with examples, what pictographs are and their limitations. Includes ideas for making a pictograph and a set of practice questions.
Khan Academy
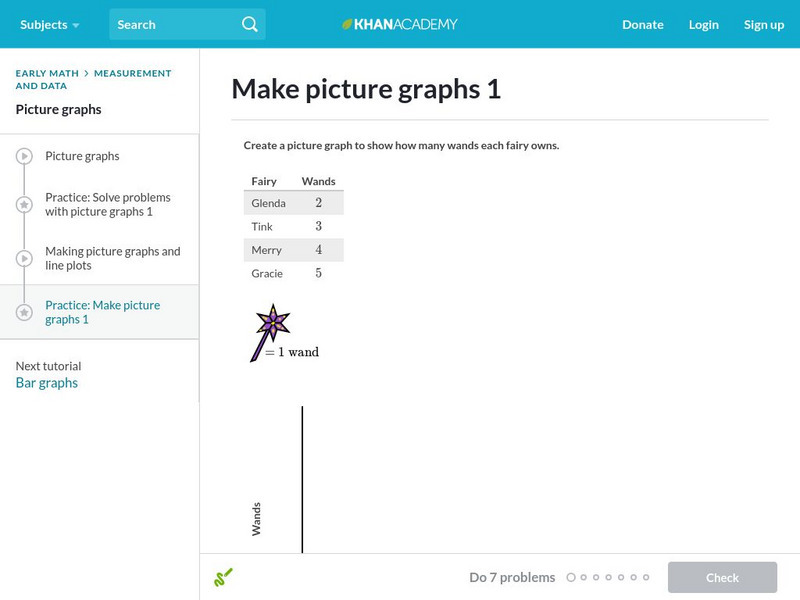
Khan Academy: Make Picture Graphs 1
A practice quiz where students construct the pictographs described in the problems. Includes hints.
Khan Academy
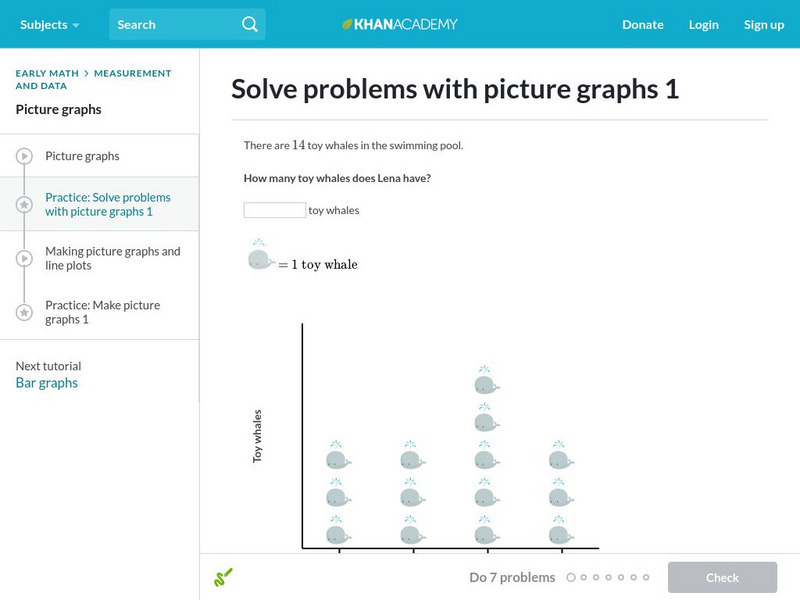
Khan Academy: Practice: Solve Problems With Picture Graphs
A practice quiz where students solve the problems by studying the pictographs. Includes hints.
Curated OER
National Park Service: Gila Cliff Dwellings National Monument
Visit the Gila Cliff Dwellings with the National Park Service and discover the cliff dwellings built and inhabited by the Mimbres, a subgroup of the Mogollon culture.
BBC
Bbc: Representing Data
This BBC Math Bite tutorial for line graphs, pictograms, and frequency polygons features an exam in which students draw and interpret statistical diagrams.
Alabama Learning Exchange
Alex: Writing Native American Style
In this lesson plan students will reinforce their knowledge about Native Americans and their culture. They will also be introduced to Native American writing. The students will read The Legend of The Indian Paintbrush by Tomie de Paolo...
Alabama Learning Exchange
Alex: You Scream, I Scream, We All Scream for Ice Cream !
Fun and yummy lesson to do on a sunny spring afternoon. Have the students take a poll of their favorite choice of ice cream and create a bar graph showing the information. This lesson plan was created as a result of the Girls Engaged in...
Better Lesson
Better Lesson: Graphing Our Favorite Ice Cream
Third graders can collect and represent data with a unique scale.
Better Lesson
Better Lesson: Class Surveys and Graphs
Students love graphing data that they "own". In this plan, the class will select a type of graph and create it using a class survey frequency table. Included in this activity are videos of the class engaged in the activity and samples of...
E-learning for Kids
E Learning for Kids: Math: Orange Trees, Olive Trees: Data and Capacity
In this lesson, students collect data related to a question, compare and order the capacity of containers, and interpret picture graphs.
E-learning for Kids
E Learning for Kids: Math: Pizza (Italian) Restaurant: Data and Chance
In this interactive site, students practice with bar and picture graphs by helping a pizza place collect and analyze their data.
E-learning for Kids
E Learning for Kids: Math: Wizards: Graphs
Join the Magic Wandia Games and learn all about graphs!
E-learning for Kids
E Learning for Kids: Math: Orange Trees, Olive Trees: Graphs
Tomas and Luna are farmers. See how many oranges and olives they have collected!


