Curated OER
Irst-quadrant Grids
In this math worksheet, students examine six first-quadrant grids. Students may plot different points on each grid or describe points for a partner to plot.
Curated OER
Locating Patterns of Volcano Distribution
Students examine patterns of volcanic distribution worldwide, use tables to plot and label location of each volcano on map, lightly shade areas where volcanoes are found, and complete open-ended worksheet based on their findings.
Curated OER
Measurement and the Illampi Mound Colony
Students comprehend the basic units of measurement, scale, plotting, and basic grids. Students practice their estimation
and measuring skills and will demonstrate their ability to work well in groups.
Curated OER
Where Did It Come From?
Students research island formation, plot locations on a map and make an analysis of why some islands are formed where they are.
Curated OER
Plotting with Pennies
Fifth graders use pennies to gather data, organize and order data, graph the data on a stem-and-leaf plot, and evaluate the range, median, and mode of the data.
Houghton Mifflin Harcourt
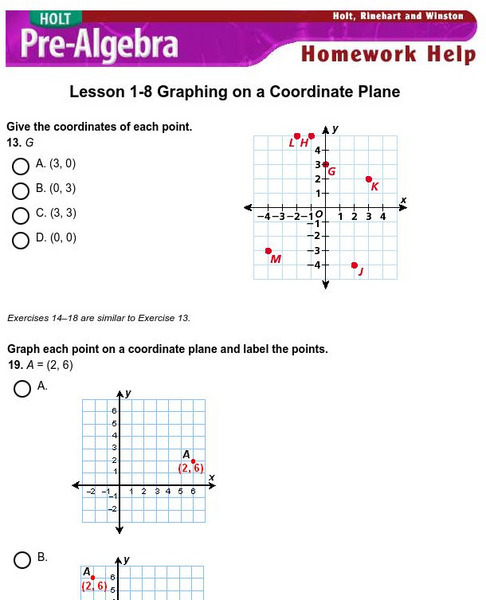
Holt, Rinehart and Winston: Homework Help Independent Practice: Coordinate Plane
Get independent practice identifying points, graphing points and equations on the coordinate plane. Each incorrect response gets a text box explanation and another try. Correct responses are confirmed.
University of South Florida
Fcat: Spaghetti Bridges: Teacher Notes
Students build bridges and test their strength to collect data and write an equation. The concept of slope is explored in this activity.
Shodor Education Foundation
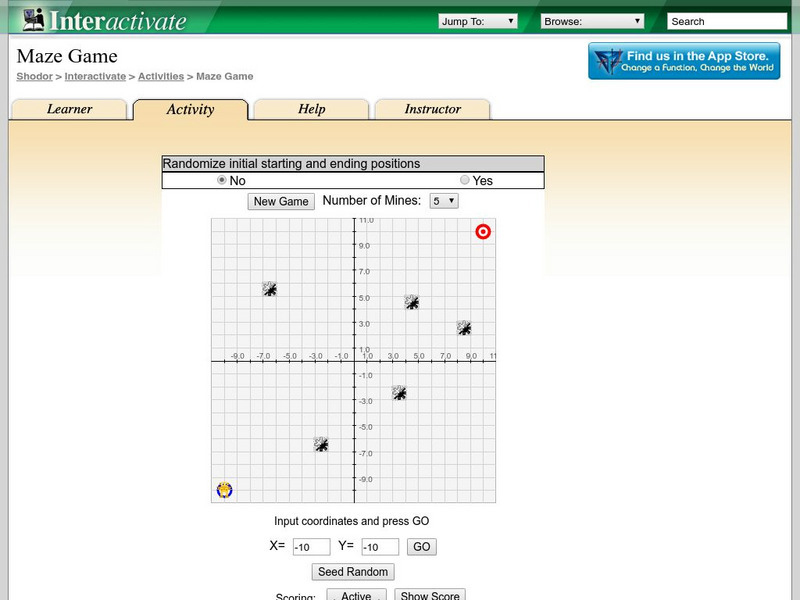
Shodor Interactivate: Maze Game
The interactive learning game has students practice their point plotting skills as they move through a mine field. The goal of the game is to get to a target location without crossing a mine.
Shodor Education Foundation
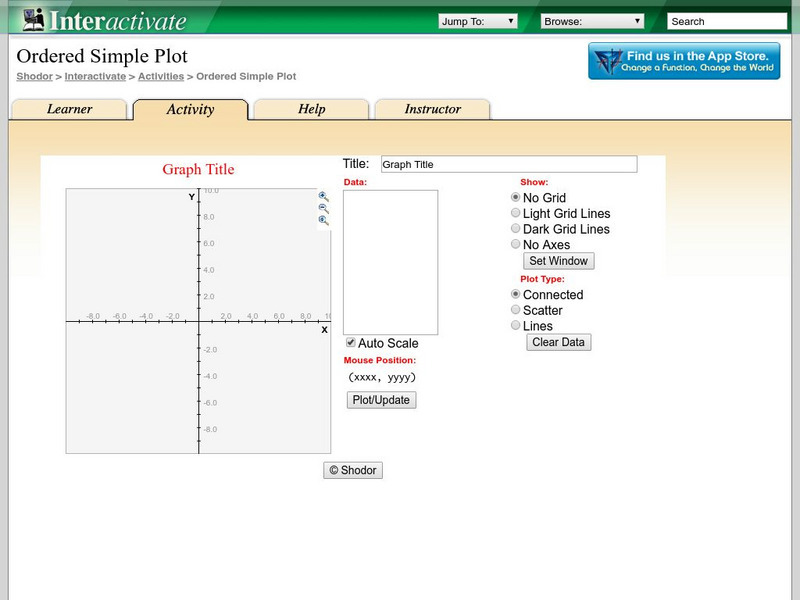
Shodor Interactivate: Ordered Simple Plot
The interactive learning activity allows students to plot multiple ordered pairs. Teacher resources are included.
Texas A&M University
Wtamu Virtual Math Lab: Intermediate Algebra
This site is a tutorial for students in algebra 2 or for those who need a refresher. The site has explanations, definitions, examples, practice problems and practice tests are found covering topics such as linear equations, graphing,...
National Council of Teachers of Mathematics
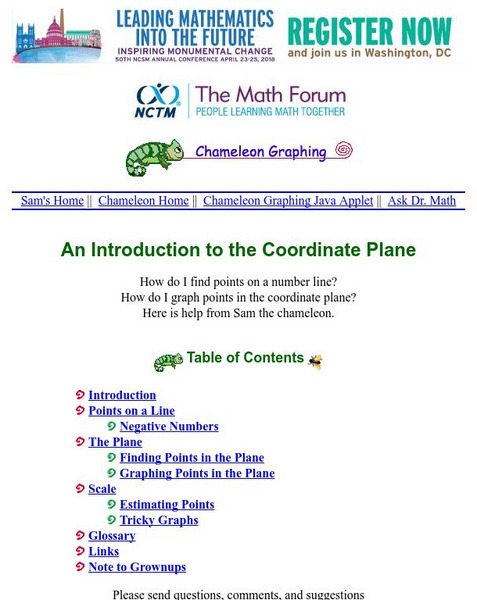
The Math Forum: Chameleon Graphing: Coordinate Plane
Dive into this introduction to graphing in the coordinate plane, and meet a chameleon named Sam. Sam will help guide you through graphing points on a line, using negative numbers, and graphing points in the coordinate plane.
Varsity Tutors
Varsity Tutors: Hotmath: Practice Problems: Graphing Ordered Pairs
Twenty-eight problems present a variety of practice graphing ordered pairs. They are given with each step to the solution cleverly revealed one at a time. You can work each step of the problem then click the "View Solution" button to...
University of Regina (Canada)
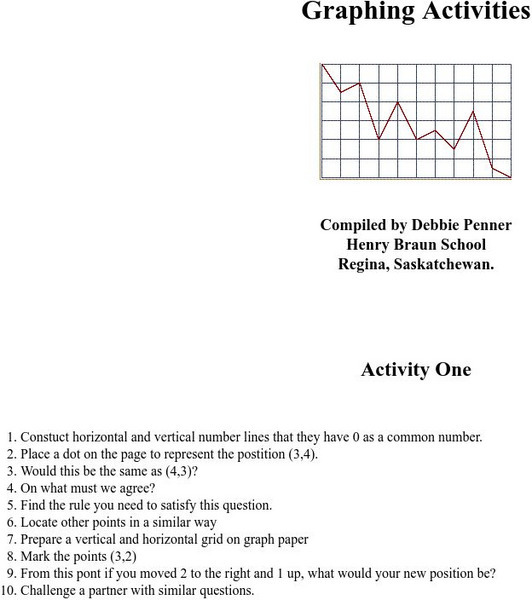
University of Regina: Math Central: Graphing Activities
Eighteen different graphing activities will teach students how to plot points, draw lines, compare graphs, and problem solve.
University of Regina (Canada)
University of Regina: Math Central: Graphing Activities
Eighteen different graphing activities will teach students how to plot points, draw lines, compare graphs, and problem solve.
Shodor Education Foundation
Shodor Interactivate: Simple Maze Game
Use this clever applet to move your robot to safe ordered pairs as it travels to its destination. This all takes place in the first quadrant. Direction are just a click away.
University of South Florida
Florida Center for Instructional Tech: Famous People
Students estimate the ages of famous people, then create a scatterplot with the actual ages. This activity allows them to estimate with linear equations. You can access the age data through the "activity" link.
Shodor Education Foundation
Shodor Interactivate: Interactive: Scatter Plot
Use this interactive applet to input a series of (x, y) ordered pairs and plot them. Parameters such as minimum and maximum value, minimum and maximum y value, and x- and y-scale can be set by the user or determined by the applet.
Texas Instruments
Texas Instruments: Coordinate Plane
Short quiz covering the coordinate plane, axes, quadrants, origin, and plotting points.
Texas Instruments
Texas Instruments: Cricket Thermometers
In this activity, students investigate the relationship between temperature and number of cricket chirps. They learn to find the other value of a function when given one value of a function. Students use linear regression and plot a set...
Texas Instruments
Texas Instruments: Getting Started With the Ti Navigator: Coordinate Graphing
This lesson introduces students to Activity Center and is intended to help students develop an initial conceptual understanding of how to plot a set of points using a coordinate grid and to create lists to represent the ordered pairs for...
Texas Instruments
Texas Instruments: At a Snail's Pace
In this activity, students plot a mathematical relationship that defines a spiral. They use technology to create a spiral and to plot a set of ordered pairs.
Texas Instruments
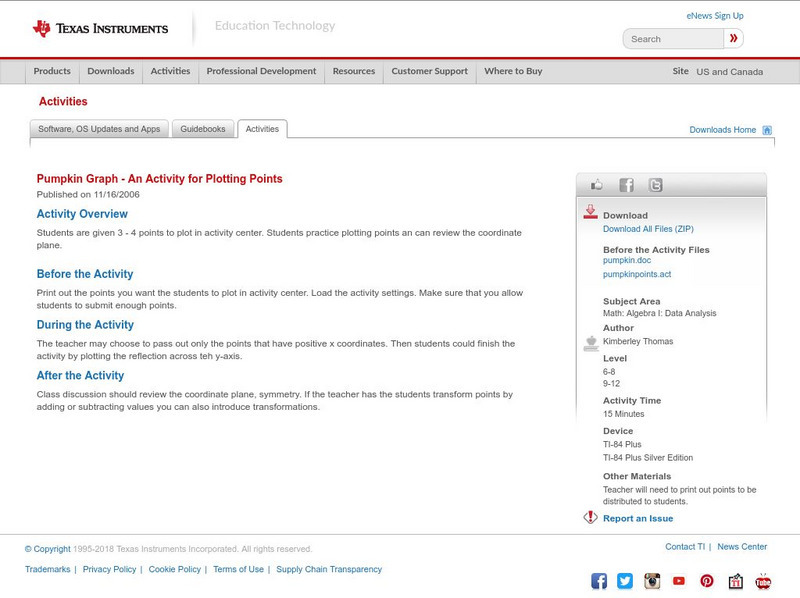
Texas Instruments: Pumpkin Graph an Activity for Plotting Points
Students are given 3 - 4 points to plot in activity center. Students practice plotting points an can review the coordinate plane.
Texas Instruments
Texas Instruments: Getting Started With the Ti Navigator System: Treasure Hunt
This introduces students to Activity Center and is intended to help students plot points in the coordinate plane.
Texas Instruments
Texas Instruments: Arrow an Activiaty for Plotting Points
Students are given points to plot in activity center. The points will form an arrow. The teacher can then direct students to change the coordinates to translate the picture. Students practice plotting points, integer operations, and see...


