Illustrative Mathematics
Illustrative Mathematics: 7.sp Election Poll, Variation 3
Members of the seventh grade math group have nominated a member of their group for class president. Every student in seventh grade will cast a vote. There are only 2 candidates in the race, so a candidate must receive at least 50% of the...
Illustrative Mathematics
Illustrative Mathematics: 7.sp Estimating the Mean State Area
The table below gives the areas (in thousands of square miles) for each of the lower 48 states. This serves as the population for this study. Your task involves taking small samples from this population and using the sample mean to...
Illustrative Mathematics
Illustrative Mathematics: 7.sp Election Poll, Variation 1
Members of the seventh grade math group have nominated a member of their group to be class president. Every student in seventh grade will cast a vote. There are 2 candidates in the race and a candidate needs at least 50% of the votes to...
Illustrative Mathematics
Illustrative Mathematics: 7.sp Election Poll, Variation 2
Members of the seventh grade math group have nominated a member of their group for class president. Every student in seventh grade will cast a vote. There are only 2 candidates in the race, so a candidate must receive at least 50 percent...
Illustrative Mathematics
Illustrative Mathematics: S Ic School Advisory Panel
How do you choose the best sampling method for a specific task? This lesson asks the students to decide the best way out of four choices to select three students to serve on a school advisory panel. Students need to defend their choice....
Khan Academy
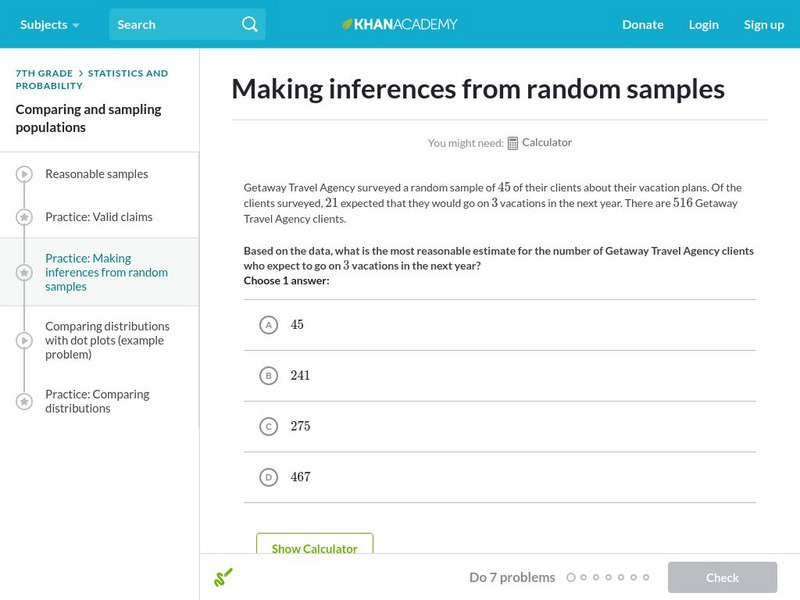
Khan Academy: Making Inferences From Random Samples
Practice making inferences from random samples.
CK-12 Foundation
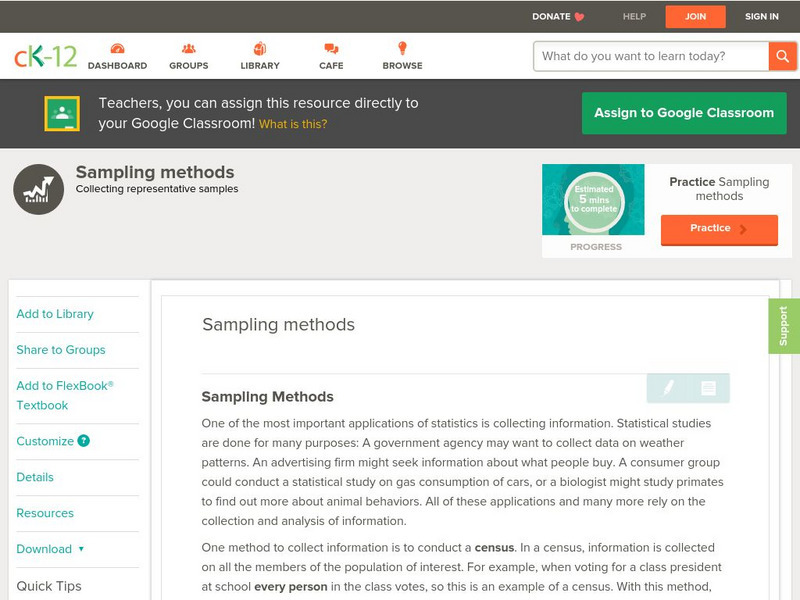
Ck 12: Statistics: Sampling Methods
[Free Registration/Login may be required to access all resource tools.] Decide how to choose a sampling of a population to produce reliable statistical results.
Other
Statistics Education Web: Bubble Trouble [Pdf]
Use random sampling to formulate, collect, and compare data from two populations. Written by Peter Banwarth of Oregon State University.
Other
Nearpod: Random Sampling
In this lesson, 7th graders will learn how to use random sampling to make generatlizations and predictions about a population.
Other
Nearpod: Displaying Data: Box Plots
In this lesson, learners will learn how to create and intrepret box plots using the 5-number summary.
SMART Technologies
Smart: Sampling and Misleading Graphs
Teachers can use Smart Exchange to download a SMART Notebook lesson covering the topic of sampling and misleading graphs.
California State University
Cal State San Bernardino: Intro to Probability Models
The concept of random variables comes to life with this Applet used to roll one, two, six, or nine dice. The user selects the number of rolls to be completed, and the program quickly counts and graphs the results.


![Statistics Education Web: Bubble Trouble [Pdf] Lesson Plan Statistics Education Web: Bubble Trouble [Pdf] Lesson Plan](https://content.lessonplanet.com/knovation/original/715465-988c4be74f96df36c2d9bcb6f2f5182f.jpg?1661829195)

