Curated OER
Profitable Soda Stand
Am I making any money? Help learners determine if their fictitious soda stand is turning a profit. They graph linear equations using the slope and y-intercept and identify the best price to use to sell soda. They identify the domain and...
Curated OER
Range, Mode, and Median
Fifth and sixth graders sort data from least to greatest and mark an X on the line plot to show how many of each number. Then they determine the range, mode, and median for the problem.
Curated OER
Algebra I: Linear Functions
Using rates from a rental car company, young mathematicians graph data, explore linear relationships, and discuss the role of slope and the y-intercept. This lesson plan allows for the discussion of independent and dependent variables,...
Curated OER
Functions - Intro and Inverses
Define the terms domain, range, function, vertical limit test, and linear function notation with your class. They can then, graph several equations applying the vertical line test to determine which are and which are not functions, write...
Curated OER
Mathematical Modeling
Study various types of mathematical models in this math lesson. Learners calculate the slope to determine the risk in a situation described. They respond to a number of questions and analyze their statistical data. Then, they determine...
Curated OER
Averages
Your class can view this resource to discover the wonders of averages. The mean, median, mode, and range are all defined, exemplified, and demonstrated. Practice problems to be completed as a class make this a really handy presentation.
Curated OER
Operations with Functions
This is a very strange but fairly amazing worksheet. You plug-in the number of problems, how you'd like them arranged, and if answers should be available and click retrieve. Like magic a worksheet to your specifications pops up. This...
Curated OER
Using Graphs
Print and use this useful unit on basic algebraic functions, domain, range, and graphing. Tasks include, illustrating simple functions with a graph, and identifying the domain and range of the function. This twelve-page packet contains...
Curated OER
Composition of Functions
In this composition of functions worksheet, students solve and complete 7 different problems related to various functions. First, they define a function, its domain and range, and also the composition of functions. Then, students solve...
Curated OER
Domain and Range: Equation
In this algebra worksheet, students state the domain and range of various functions and equations. There are five questions and some are multiple choice questions.
Curated OER
Impervious Surfaces
Students comprehend impervious surfaces. They recognize the problems caused by impervous surfaces. Students observe how land use can influence impervious surfaces. They chose four of the seven basic land surface, students draw a picture...
Radford University
“FUN-ctions” Find the Equation of a Scream
Take a function along for a ride. Given the graph of a roller coaster track, pupils determine key features of the graph such as the maximum, minimum, intervals of increase and decrease, and roots. They figure out the equation of the...
Curated OER
Density of a Paper Clip Lab Review
Even though this assignment is brought to you by Physics Lab Online, it is best used as a math practice. Middle schoolers calculate the range, mean, mode, and median for a list of eight different paper clip densities. They analyze...
Curated OER
Maps and Modes, Finding a Mean Home on the Range
Fifth graders investigate data from maps to solve problems. In this data lesson, 5th graders study maps and collect data from each map. Students present their data in a variety of ways and calculate the mode, mean, median, and range.
Curated OER
Worksheet 31 - Doman & Range
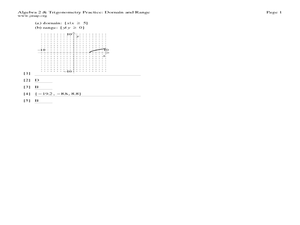
In this function worksheet, students determine the domain and range of given functions. They use trigonometric ratios to determine if a statement is true or false. Students differentiate equations. In this one-page worksheet, students...
Curated OER
Using Averages
In this math worksheet, students compute the range, mean, median and modal weight of candy bars from two machines. Students write a short essay about which machine is using too much chocolate and which is more reliable.
Curated OER
Piecewise-Defined Functions 2
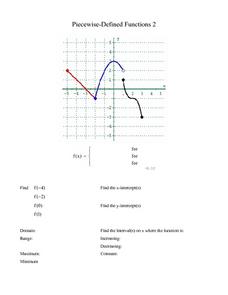
In this Piecewise-Defined function worksheet, 10th graders identify the function for a given graph. Additionally, they find the y-intercept, y-intercept, domain, range and interval of each function. Students solve this information for...
Curated OER
Piecewise-Defined Functions 1
In this piecewise-defined function, students explore the graph of given functions and match it to the proper equation. They identify the x and y-intercepts, domain, range, and interval of each function. There are approximately ten...
Curated OER
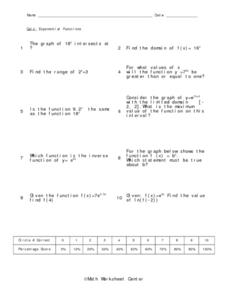
Quiz: Exponential Functions
With this quiz, high schoolers solve 10 different problems that include various exponential functions. First, they determine where the graph of a point intersects at what origin. Then, they determine the domain and range. In addition,...
Curated OER
Domain and Range
In this domain and range worksheet, students write the definitions for relation, function, domain and range. They then find the domain and range of 7 sets of ordered pairs. Finally, students answer 4 questions regarding inverse relations...
Curated OER
Graphs and Transformations of Functions
Is it possible to solve quadratic equations by factoring? It is, and your class will graph quadratic equation and functions too. They perform transformation on their graphs showing increasing and decreasing intervals, domain, and range....
Curated OER
What's Your Average? What Do You Mean? I'm More Than Just Average
Upper grade and middle schoolers collect data, analyze and interpret the data. This three-part lesson should provide learners with a firm understanding about the differences between mean, median, and mode and how to perform the...
Curated OER
Quiz: Mean, Median, Mode, and Range
Use this measure of central tendency worksheet to have learners find mean, median, mode and range of ten sets of nine numbers. Numbers are presented in a series of lists.
Curated OER
Line Plots - Homework 6.3
Elementary schoolers use data in a table to make a line plot, then answer five related questions. Houghton Mifflin text is referenced.


