Curated OER
Find the Range #2
In this finding the range activity, students find the mean, median, mode, and range of each of six number sets. They write the answers in the boxes next to each label.
Curated OER
Calculus 30: Domain and Range
In this domain and range worksheet, students find the domain and range of 23 equations. Students find the domain and range from a graph and determine a graph given the domain and range.
Curated OER
Calculus 30 - Typical Exam Questions
In this limits and functions instructional activity, students solve 30 short answer questions about calculus Students find limits, domain, range, tangent lines, derivatives, and composition functions.
Curated OER
Info. From a Graph
In this graphing learning exercise, students answer 13 questions about 3 graphs. Students determine the degree, roots, y-intercepts, inflection points, multiplicity, etc. of three different graphs.
Curated OER
Domain and Range
In this domain and range worksheet, students examine graphs and find the domain and range of each function. This one-page worksheet contains 6 problems.
Raytheon
Equations and Graphing Review
In this equations and graphing review instructional activity, learners write, graph and solve equations for 62 problems, including a mid-unit review, with answers included.
Curated OER
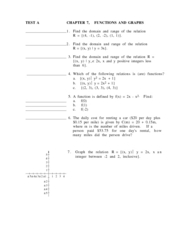
Chapter 7. Functions and Graphs
In this functions and graphs worksheet, students determine the domain and range of a given relation. They graph functions on a coordinate plane and write equations in the slope-intercept form. This twelve page worksheet...
Curated OER
Relation, Function, Domain, & Range
In this relation, function, domain, and range worksheet, students answer 6 open-ended questions about relations and functions. Students determine the domain and range of a function. Students give examples and non-examples of...
Curated OER
Ranging the Triple M's
Fifth graders explore collecting and analyzing data. In this mean, median and mode lesson, 5th graders use real word data to determine the mean, median and mode. Students are given sets of numbers on index cards as asked to find the...
Curated OER
Range, Mean, Median, and Mode
Eighth graders find the range, median, mean, and mode of a data set. In this finding the range, median, mean, and mode of a data set lesson, 8th graders collect data about the high and low temperature for 10 different cities. ...
Curated OER
Range, Mean, Median and Mode Through the Internet
Students compute measures of central tendency. In this range, mean, median and mode lesson, students gather information on the internet, organize the data and then compute the measures of central tendency. They create a...
Curated OER
Algebra Nomograph
Investigation of a nomograph teaches students to determine the rule of a function by examining the input and output values. Students use a nomograph on their Ti-Nspire to determine the function rule. Students make a scatter...
Curated OER
The Energy of Empty Space
In this energy in empty space instructional activity, students use an equation for Cosmic Inflation to solve eight problems. They find the domain and range of the function of the equation, they determinethe axis of symmetry, they find...
Curated OER
Logarithms
High schoolers explore the concept of logarithms. In this logarithms learning exercise, students answer true/false questions about logarithms. High schoolers simplify logarithms and condense and expand logarithms.
Curated OER
Atlatl Lessons Grades 4-12: Lesson for Beginning Users of Atlatl
Sixth graders determine the mean, range median and mode of a set of numbers and display them. In this data lesson students form a set of data and use computer spreadsheet to display the information. They extend of the process by...
Curated OER
Graphing Logarithms
In this logarithms worksheet, students identify the domain and range of given logarithms. They sketch the graph on a coordinate plane. This four-page worksheet contains 12 multi-step problems. Answers are provided on the last two pages.
Curated OER
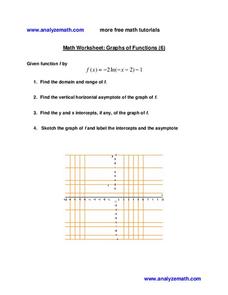
Graphs of Functions
In this graphs of functions instructional activity, students identify the domain and range of a function. They determine the vertical horizontal asymptote and find the y and x intercepts. Students sketch a graph of the function. This...
Curated OER
Inequalities and Measures of Central Tendency
In this inequality and measures of central tendency worksheet, students solve and graph linear inequalities. They organize given data to identify the mean, mode and range. Students interpret box-and-whisker plots. This three-page...
Curated OER
Bikini Bottom Olympics Skill: Best Value and Uncertainty
In this best value and uncertainty activity, learners solve multiple problems where they calculate the best value, the uncertainty and the range in the data given.
Curated OER
Graphing Functions
In this graphing functions worksheet, 11th graders solve and complete 10 different types of problems. First, they graph each function and list the asymptote, domain and range for each. Then, students sketch each graph. They also draw and...
Curated OER
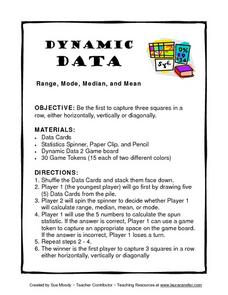
Dynamic Data Range, Mode, Median, and Mean
In this lesson, Dynamic Data Range, Mode, Median, and Mean, students play a game while figuring range, mode, median, and mean. Students spin for their task, figure the mode, mean, median or range of a row of numbers and gain a space on...
Curated OER
Madley Brath #39 - Stem and Leaf Plots, Mean, Median, Mode and Range
For this measures of central tendency worksheet, students draw a stem and leaf plot of a set of test scores. They compute the mean, median, mode, and range of the data set, and round the answers to the nearest tenth.
Curated OER
Algebra 1: Unit 5 Review
For this problem solving worksheet, 6th graders determine if 4 functions are exponential growth or decay, sketch 4 graphs and compare 2 sets of functions. Students write the rule, linear or exponential, for 4 tables.
Curated OER
Statistics - Central Tendency
In this statistics worksheet, students solve and complete 13 different problems that include creating various box-and-whisker plots. First, they write a definition for mean, median, mode and range. Then students explain how to determine...


