Los Angeles County Office of Education
California State Standards: Algebra I
Starting a year of Algebra I? This mighty packet practices all of the major topics with different ranges of difficulty. Standards include everything from linear to quadratic to rational expressions. Use it in a...
Illustrative Mathematics
Oakland Coliseum
Help algebra learners relate a real-life function that happens at the Oakland Coliseum every time the Raiders play. The resource states that the revenue of the Oakland Raiders home games is a function of the number of seats sold and the...
Mathematics Assessment Project
Mean, Median, Mode, and Range
What a find! Here is a lesson, designed to meet sixth grade math Common Core standards, that focuses on the calculation of different measures of center for the scores from a penalty shoot-out competition. An independent...
National Security Agency
Are You Ready to Call the Guinness Book of Records?
Learners design questions that can be answered by collecting data. For this line-plot lesson, pupils collect data and graph on a line plot on world records. An abundant supply of teacher support is provided in this resource.
Texas Instruments
Is It or Isn't It Proportional
How can you tell if number relationships are proportional? Mathematicians investigate proportional relationships. They compare and contrast functions and graphs to determine the characteristics of proportional relationships, as well as...
K20 LEARN
You’re The Network: Data Analysis
How do you rate? Young scholars use graphical data to analyze ratings of different television episodes. Their analyses include best-fit lines, mean, median, mode, and range.
American Statistical Association
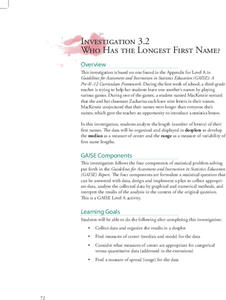
Who Has the Longest First Name?
Name that statistic! Classmates each write their name and the number of letters in it on a sticky note to place on the board. As a class, they determine the median, mode, and range of the name lengths, and create a dot plot of the data....
Workforce Solutions
30 Seconds
Thirty seconds are all scholars have to develop an engaging commercial to showcase their talents and experience within a specific occupation. Pairs work collaboratively to keep each other on time to deliver information speedily and ask...
Flipped Math
Unit 7 Review: Exponential Functions
Take a break from learning new information and take time to review. Scholars review the unit by completing some practice problems. They rewrite expressions using exponents, solve exponential equations, graph exponential functions,...
Flipped Math
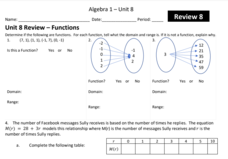
Unit 8 Review: Functions
Let's finish a functional review. Pupils work through 31 items to review the concepts learned in Unit 8. Scholars determine whether a mapping is a function and identify the domain and range. Using function notation, individuals then...
Flipped Math
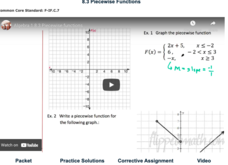
Piecewise Functions
Break it up into pieces to solve the problem. Individuals watch a video on how to graph and determine the equation and values of piecewise functions. Viewers then work several exercises to practice evaluating a piecewise function at...
Flipped Math
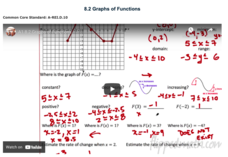
Graphs of Functions
Create a graphical description. Pupils watch a video presentation starting with vocabulary on properties of a graph of a function and then use the vocabulary to find key features of graphs of a function. Scholars use three graphs in the...
Flipped Math
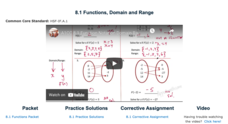
Functions, Domain and Range
Take a deeper dive into the notation of a function. The video presentation uses grocery store prices as an example to explain the concept of a function. Pupils determine whether mappings are functions or not and find the domain and...
Flipped Math
Unit 4 Review: One Variable Statistics
It's always nice to slow down and review. Scholars work on problems covering concepts on one-variable statistics. They create and interpret box plots and stem-and-leaf plots, determine the mean, median, mode, interquartile range, and...
EngageNY
Solving Problems by Function Composition
Stay composed while solving problems. Learners put their knowledge of compositions to solve problems. To connect with the concept, scholars compose equations to answer questions from real-world situations. Finally, pupils practice using...
EngageNY
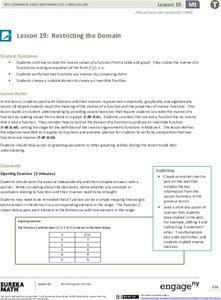
Restricting the Domain
But what if the function cannot be inverted? Pupils continue to work with inverses of functions using tables, graphs, and algebraic equations. They restrict the domain of non-invertible functions to make them invertible. Using...
EngageNY
Inverse Functions
Undo the functions. Learners refresh their knowledge of inverses of functions from Algebra II in the 19th section of a 23-part Precalculus unit. Pupils look at inverses in tables and graphs. They then add to their understanding of...
EngageNY
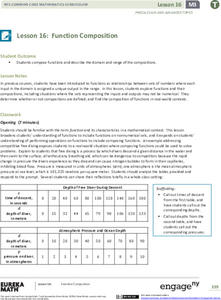
Function Composition
Combine functions for the first time. Pupils investigate composition of functions using a function table and then function machines in the 17th installment in a 23-part Precalculus series. Scholars learn the two notations for composition...
Radford University
Analyzing Data from Peer Survey
We all want to know what we're thinking. Scholars analyze and report data collected in a previous survey on peer attitudes toward current events. They calculate the mean, median, range, and standard deviation before creating histograms...
Radford University
Animal Decline
Where did they all go? Small groups collect data on different animal species that are on a decline. Teams develop equations to model the populations over time and then create presentations about the decline of their animals. Classmates...
Radford University
Box-and-Whisker Activity
Think inside the box. Working in small groups, pupils design a study to answer comparing two data sets. Team members collect data and construct box-and-whisker plots and analyze them to prove or disprove their hypothesis. They develop...
Radford University
Pizza, Pizza!
Ponder the problem of pizza prices. Pupils use provided information about two different pricing schedules for pizza. They create tables of values and functions to represent the pricing schemes, consider domain restrictions, and identify...
Radford University
Linear Equations in Real Word Problems
Make up a story about a linear graph. Scholars identify key features of a linear graph, such as intercepts, domain and range, and slope. They then create a word problem that could be represented by the graphed line.
National Museum of Mathematics
Hands-On Data Analysis
Jump at the chance to use this resource. A kinesthetic activity has classmates jumping in several different ways (standing, single-step, and multiple-step jumps) to create handprints on poster paper taped to the wall. They measure the...


