Varsity Tutors
Varsity Tutors: Hotmath: Practice Problems: Derivatives
Hotmath provides 26 practice problems dealing with derivatives and their graphs. Each of the practice problems include a step-by-step guide for solving their derivative.
Varsity Tutors
Varsity Tutors: Hotmath: Practice Problems: Relations and Functions
Hotmath provides 25 practice problems dealing with relations, functions, and their graphs. Each of the practice problems include a step-by-step guide for solving their Algebraic problem.
National Council of Teachers of Mathematics
Nctm: Figure This: Math Challenges for Families
Students, teachers, and parents alike will enjoy this challenging math site. It contains a clever brain teaser section plus creative problems related to algebra, geometry, measurement, numbers, statistics, and probability. A Spanish...
Texas Education Agency
Texas Gateway: Determining Reasonableness of Solutions (System of Equations)
Given verbal descriptions of situations involving systems of linear equations, the student will determine the reasonableness of the solutions to the system of equations.
Texas Instruments
Texas Instruments: A Sweet Drink Adventure 7
Students determine how the temperature of water affects the dissolving time of a sugar cube. They create, interpret and analyze graphs of data, find an equation of the line of best fit, and relate slope to rate of change.
Texas Instruments
Texas Instruments: Getting Started With the Ti Navigator: Discount Savings
This lesson is intended to help students develop an understanding of sale information to compute discounts, discount rates, original prices and sale prices.
Texas Instruments
Texas Instruments: Math Today Population on the Move
In this activity students will determine the rate of change (slope) & build a linear model (y = mx + b) from this data. The model will be used to make a prediction about the future growth of the population of the U.S. if the current...
Texas Instruments
Texas Instruments: Animal Skin Adventure 6
In this adventure, students make two models to simulate the cooling rate of different skin surface areas and determine the effect of skin surface area on the results. Students graph temperature as a function of time, interpret, and...
Texas Instruments
Texas Instruments: Math Today for Ti Navigator System More of u.s.
Using the USA TODAY Snapshot, "More of U.S.," students will learn how to interpret data presented in a graphical form. Students will determine the rate of change (slope) and build a linear model (y = mx + b) from this data. The model...
Texas Instruments
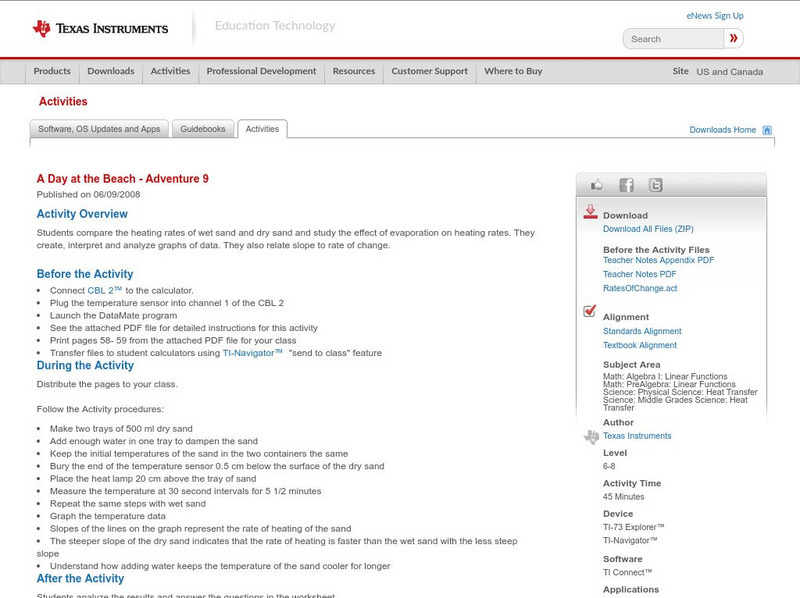
Texas Instruments: A Day at the Beach Adventure 9
Students compare the heating rates of wet sand and dry sand and study the effect of evaporation on heating rates. They create, interpret and analyze graphs of data. They also relate slope to rate of change.
Texas Instruments
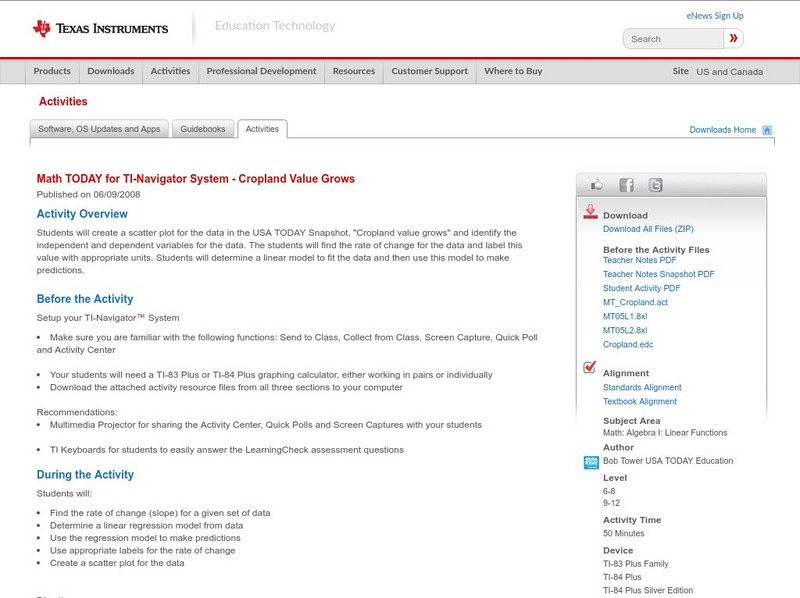
Texas Instruments: Math Today for Ti Navigator System Cropland Value Grows
Students will create a scatter plot for the data in the USA TODAY Snapshot, "Cropland value grows," and identify the independent and dependent variables for the data. The students will find the rate of change for the data and label this...
Texas Instruments
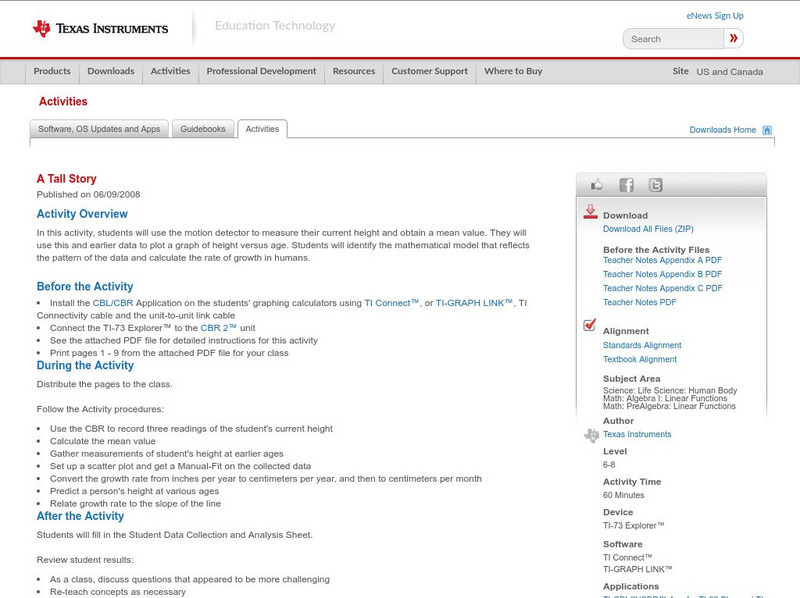
Texas Instruments: A Tall Story
In this activity, students can use the motion detector to measure their current height and obtain a mean value. They will use this and earlier data to plot a graph of height versus age. Students will identify the mathematical model that...
Texas Instruments
Texas Instruments: Walk This Way: Definition of Rate
In this activity, students' will use a motion detector to record distance and velocity versus time information for a walker. They find the area under the velocity versus time graph and compare it to the actual distance traveled by the...
Texas Instruments
Texas Instruments: Active Wear Adventure 10
In this adventure, students test which solar collector--black, white, or silver-- absorbs the most heat. They compare the difference between absorption and reflection. They create, interpret and analyze graphs of data. They also relate...
Texas Instruments
Texas Instruments: Match the Graph
In this activity, students walk in front of a calculator-based ranger CBR and try to match a distance-time graph. They examine the rate of change, and analyze and interpret the graph of a function.
Texas Instruments
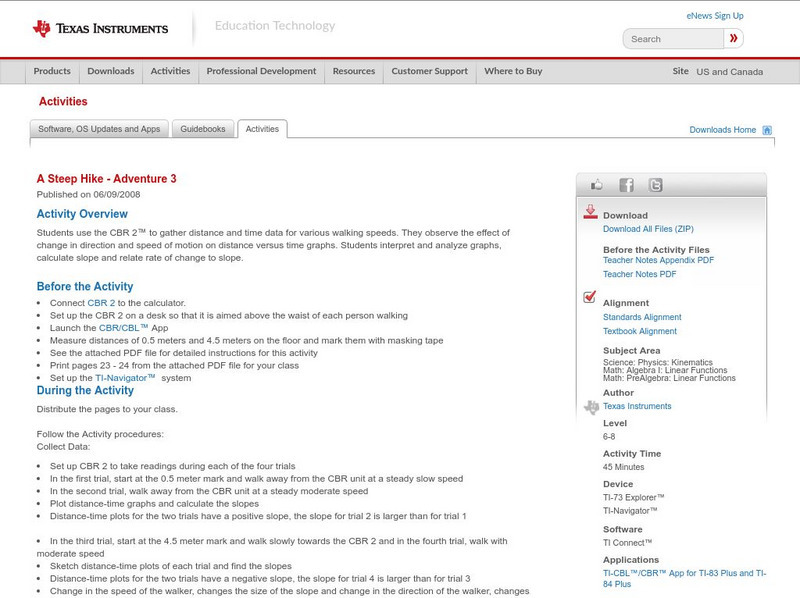
Texas Instruments: A Steep Hike Adventure 3
Students use the CBR 2 to gather distance and time data for various walking speeds. They observe the effect of change in direction and speed of motion on distance versus time graphs. Students interpret and analyze graphs, calculate slope...
Texas Instruments
Texas Instruments: How Fast for Whiplash? Going With the Flow
In this activity, students recognize direct variation as a rate of change and apply it in problem situations. They also use average rates of change to make decisions in problem situations.
Texas Instruments
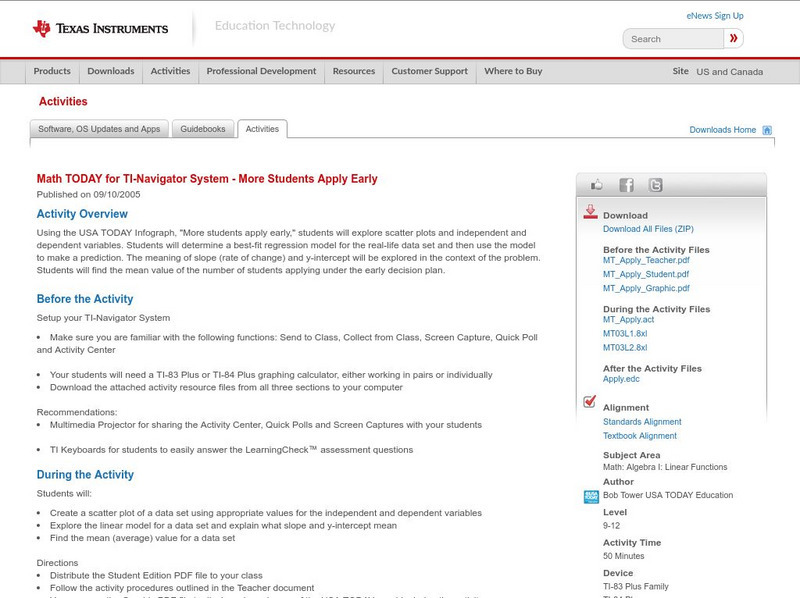
Texas Instruments: Math Today for Ti Navigator System: More Students Apply Early
Using the USA TODAY Infograph, "More students apply early," students will explore scatter plots and independent and dependent variables. Students will determine a best-fit regression model for the real-life data set and then use the...
Texas Instruments
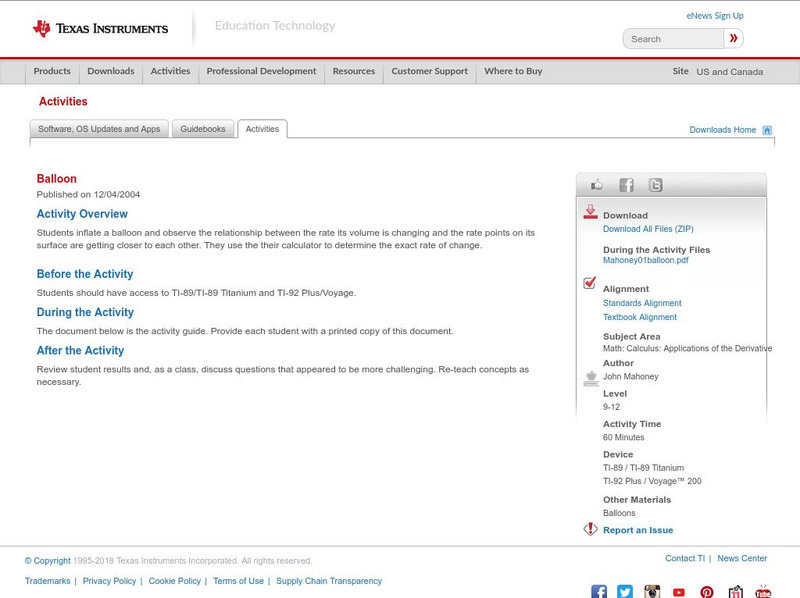
Texas Instruments: Balloon
Students inflate a balloon and observe the relationship between the rate its volume is changing and the rate points on its surface are getting closer to each other. They use the their calculator to determine the exact rate of change.
Texas Instruments
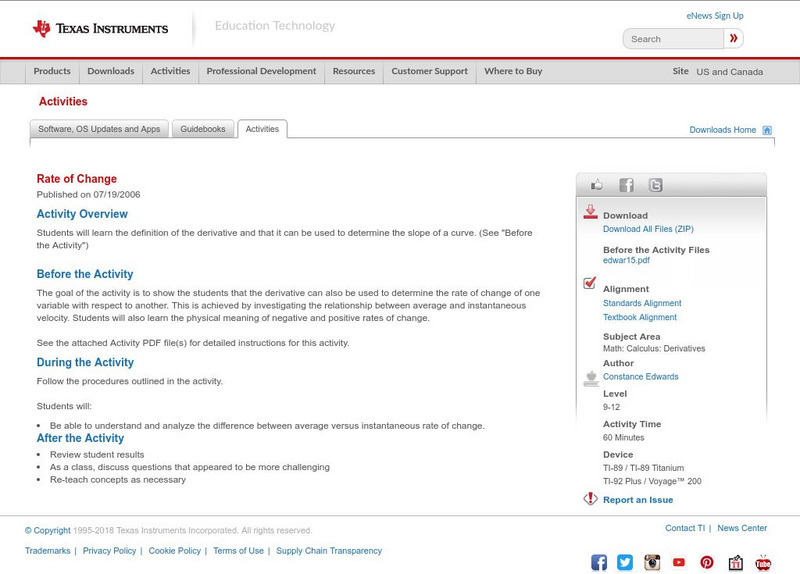
Texas Instruments: Rate of Change
This activity is designed for students who have already learned the definition of the derivative and that it can be used to determine the slope of a curve. (Continued. See "before the activity.")
Science Education Resource Center at Carleton College
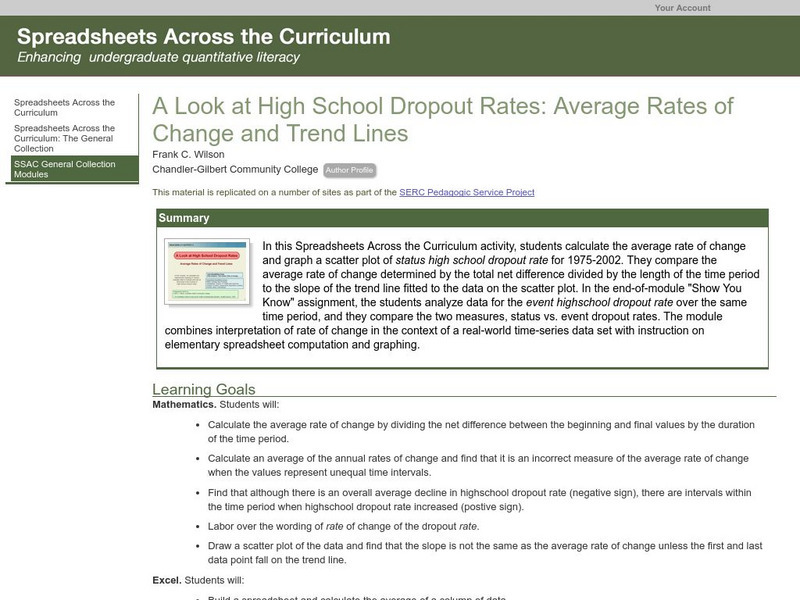
Serc: Average Rates of Change and Trend Lines
In this Spreadsheets Across the Curriculum activity, students calculate the average rate of change and graph a scatter plot of status high school dropout rate for 1975-2002. The module combines interpretation of rate of change in the...
Texas Instruments
Texas Instruments: Sack Race
The primary focus should be on slope as rate of change and piecewise functions. This activity allows exploration of multiple types of slope; i.e., positive slope, negative slope, or zero slope for students to build their understanding of...
University of Colorado
University of Colorado: Ph Et Interactive Simulations: Ph Et: Function Builder
Play with functions while you ponder Art History. Explore geometric transformations and transform your thinking about linear functions, then have fun figuring out the mystery functions.
Ministry of Education and Universities of the Region of Murcia (Spain)
Ministerio De Educacion Y Ciencia: Tasa De Variacion De Una Funcion
In Spanish. In this interactive activity you will learn and understand the concept of average and instantaneous speed and calculate the average and instantaneous variation of some functions.


