Curated OER
Slope Calculation
Students compute the slope of a line based on the coordinates of two points on the line. In addition, they examine the relationship between the numerical value of slope and its properties on a graph.
Curated OER
Slope Calculation
Learners compute the slope of a line that passes through two points and explain how the slope formula is derived. They determine properties associated with positive, negative, undefined, and no slope.
Curated OER
Life on the Edge: Exploring Deep Ocean Habitats Cool Corals
Students research the basic morphology of Lophelia corals and polyps to determine the significance of these organisms. They detail the reasons that biological communities are focusing on the Lophelia corals as major conservation efforts.
Curated OER
That's a Fine Line You're Walking!
Students experiment with Hiker program to practice real world applications of linear functions and develop their understanding of expressions, relationships, and manipulations involved in writing and graphing linear equations in...
Curated OER
Sloping and Intersecting a Linear Function
Learners examine and discuss typical linear equations, and the difference between a linear and nonlinear equation. They observe examples of linear equations and complete a worksheet.
Curated OER
Rocketsmania And Slope
Students use a professional basketball team's data and graph it on a coordinate plane. They draw a line of regression and finding its equation. They access a website containing statistics for the Houston Rockets basketball team to solve...
Curated OER
Introduction to Linear Functions
Students are introduced to the basic ideas needed for understanding linear functions.
Curated OER
Soil Slope
High schoolers study how to measure the soil slope of an area. In this soil lesson young scholars work in groups and complete an activity that allows them to find the slope of a given area.
Curated OER
Graphing Linear Functions Using Their Slopes
In this Algebra I learning exercise, 9th graders graph a linear function using its slope. The one page learning exercise contains one multiple choice problem with the solution.
Curated OER
Positive Slope, Negative Slope, or Neither
In this slope activity, students identify the slope of 4 lines. Students determine if a line has positive, negative, no slope or undefined slope.
Curated OER
Count the Differences
Learners determine the degree of polynomials. In this determining the degree of polynomials lesson, students find the difference between consecutive y-values. Learners find the degree of a linear, quadratic, and cubic function by this...
Curated OER
Mine Lesson #1: Slope slider
Eighth graders investigate linear equations. In this Algebra I lesson, 8th graders explore the effects that manipulating a linear equation has on the graph of the function through the use of a java applet.
Curated OER
Coordinate Proofs
Students explore the concept of coordinate proofs. In this coordinate proofs lesson, students write coordinate proofs using properties of distance, slope, and midpoint. Students discuss why it is sometimes beneficial to double the...
Curated OER
Slope
In this slope worksheet, students solve and complete 3 different types of problems. First, they find the slopes of the lines passing through each sets of coordinate pairs. Then, students find the parameter so that the line passing...
Curated OER
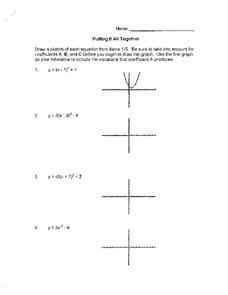
Parabolas
In this parabolas worksheet, learners solve and complete 12 different types of problems. First, they draw a sketch of each equation shown. Then, students write the vertex form of each graph on the line provided.
Curated OER
Variables and Slopes
In this variable and slopes worksheet, learners practice a warm-up activity involving variables V and X and using Euler's Method to solve a value problem.
Curated OER
Practice Problems for Linear Equations and Graphs
A worksheet that could also be used as a quiz presents students with 20 linear equations. They graph, solve for the slope, and intercepts of 8 equations. Students solve for the equation of a line, passing through given points for 6 sets...
Curated OER
Finding Our Top Speed
Learners determine the length of time needed to walk or run or walk a given distance. They plot the data on a graph and use the results of data collection to develop the concept of slope.
Curated OER
Equations of Lines
Students define slope, and practice finding the slope of lines through given points. They determine the angle of inclination. Students find the relationship between the slope and the tangent of the lines. Students determine special...
Curated OER
Systems of Linear Inequalities in Slope-Intercept Form -- Lecture
Students are introduced to linear inequalities in slope-intercept form. As a class, they participate when needed in a demonstration given by their teacher and practice graphing inequalities and describing the solution. They set up and...
Curated OER
How Low Can You Go?
Middle schoolers are introduced to the concepts of elevation and slopes. Using Minneapolis and St. Paul, they graph elevation of various cities in a scenerio given to them. They also calculate the total miles traveled and organize the...
Curated OER
Mathematics Within: Algebraic Patterns
Pupils discover patterns in linear equations by playing a dice game to collect data. They graph the data and analyze the patterns of the lines created by the data. The class then compares the individual graphs to evaluate the position of...
Curated OER
Track's Slippery Slope
Students graph data of sports figure running time using x-axis y-axis to find slope of trend line, mathematically find the interpolated and extrapolated values for data points. Using the information they make predictions.
Curated OER
Slope Calculation
Students practice calculating the slope of a line. They explain how the formula is derived and identify properties that are associated with positive, negative and undefined slopes. They complete an online activity as well.


