Flipped Math
Unit 5 Review: Bivariate Data
The data says it's a wrap. Pupils work through four review questions with multiple parts dealing with bivariate data. Questions cover creating and interpreting two-way tables and scatter plots with lines of best fit. Scholars finish up...
Flipped Math
Frequency Tables
What's the association? Pupils watch a presentation on creating a two-way frequency table. Learners find out how to calculate relative frequencies within the table to determine whether there is an association between the two categories....
College Board
2006 AP® Statistics Free-Response Questions Form B
Test a significant review of statistical questions. The resource provides pupils and teachers with insight into the way the exam assesses statistical concepts. Half of the released questions from the 2006 AP® Statistics Form B questions...
CCSS Math Activities
Smarter Balanced Sample Items: 8th Grade Math – Target J
Look at patterns in bivariate data. Eight sample items illustrate the eighth grade statistics and probability standards. The Smarter Balanced Sample multiple-choice items focus on numerical and categorical bivariate data. The slide show...
Concord Consortium
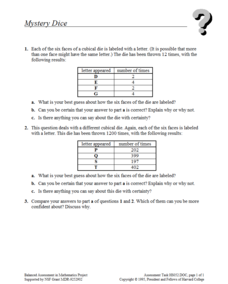
Mystery Dice
Dice aren't typically mysterious devices, but these dice are anything but typical. Scholars try to come up with dice that match given information on the relative frequency when they roll them a certain number of times. They must then...
Concord Consortium
Dubious Dice
How many ways can you slice dice distribution? A short performance task asks pupils to consider different types of distributions. Given histograms showing a triangular distribution and a bimodal distribution, they create pairs of dice...
Texas Instruments
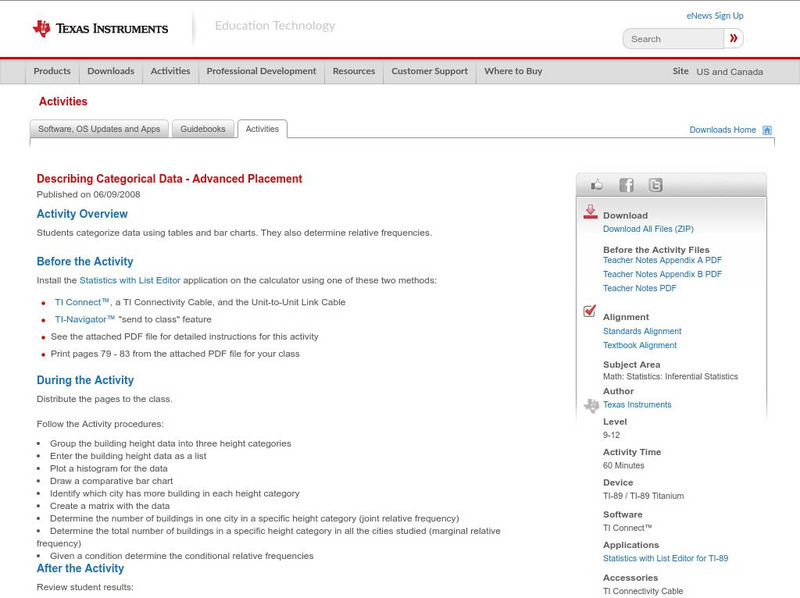
Texas Instruments: Describing Categorical Data Advanced Placement
Students categorize data using tables and bar charts. They also determine relative frequencies.


