Virginia Department of Education
z-Scores
Just how far away from the mean is the data point? Pupils calculate the standard deviation for a set of data and find out how many standard deviations a point is away from the mean. The teacher leads a discussion on how to calculate...
Virginia Department of Education
Exploring Statistics
Collect and analyze data to find out something interesting about classmates. Groups devise a statistical question and collect data from their group members. Individuals then create a display of their data and calculate descriptive...
Virginia Department of Education
Analyzing and Interpreting Statistics
Use measures of variance to compare and analyze data sets. Pupils match histograms of data sets to their respective statistical measures. They then use calculated statistics to further analyze groups of data and use the results to make...
Virginia Department of Education
Normal Distributions
Pupils work to find probabilities by using areas under the normal curve. Groups work to calculate z-scores and solve real-world problems using the empirical rule or tables.
Statistics Education Web
It Creeps. It Crawls. Watch Out For The Blob!
How do you find the area of an irregular shape? Class members calculate the area of an irregular shape by finding the area of a random sampling of the shape. Individuals then utilize a confidence interval to improve accuracy and use a...
Mathematics Vision Project
Module 8: Statistics
What does it mean to be normal in the world of statistics? Pupils first explore the meaning of a normal distribution in the eight-lesson module. They then apply the statistics related to normal distributions such as mean, standard...
Teach Engineering
Understanding the Air through Data Analysis
Is there a correlation or causation relationship between air pollutants? Groups develop a hypothesis about the daily variation of air pollutants, specifically ozone and CO2. Using Excel to analyze the data, the groups evaluate their...
EngageNY
Normal Distributions (part 2)
From z-scores to probability. Learners put together the concepts from the previous lessons to determine the probability of a given range of outcomes. They make predictions and interpret them in the context of the problem.
EngageNY
Normal Distributions (part 1)
Don't allow your pupils to become outliers! As learners examine normal distributions by calculating z-scores, they compare outcomes by analyzing the z-scores for each.
EngageNY
Using a Curve to Model a Data Distribution
Show scholars the importance of recognizing a normal curve within a set of data. Learners analyze normal curves and calculate mean and standard deviation.
EngageNY
Distributions—Center, Shape, and Spread
Data starts to tell a story when it takes shape. Learners describe skewed and symmetric data. They then use the graphs to estimate mean and standard deviation.
EngageNY
Mid-Module Assessment Task - Algebra 1 (module 2)
A mid-module assessment uses two multi-part questions to measure progress toward mastery on descriptive statistics standards. Each part of a question addresses a single standard to help determine mastery.
Stats Monkey
Everything I Ever Needed to Learn about AP Statistics I Learned from a Bag of M and M's®
Candy is always a good motivator! Use this collection of M&M's® experiments to introduce statistics topics, including mean, standard deviation, nonlinear transformation, and many more. The use of a hands-on model with...
Fort Bend Independent School District
Data Analysis - AP Statistics
What better way to study survey design than to design your own survey! Bring a versatile data analysis project to your AP Statistics class, and encourage them to apply the practices from their instructions to a real-world survey...
EngageNY
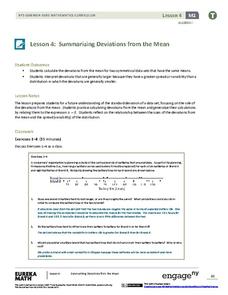
Summarizing Deviations from the Mean
Through a series of problems, learners determine the variability of a data set by looking at the deviations from the mean. Estimating means of larger data sets presented in histograms and providing a way to calculate an...
EngageNY
Measuring Variability for Symmetrical Distributions
How do we measure the deviation of data points from the mean? An enriching activity walks your class through the steps to calculate the standard deviation. Guiding questions connect the steps to the context, so the process...
EngageNY
Interpreting the Standard Deviation
Does standard deviation work for non-symmetrical distributions, and what does it mean? Through the use of examples, high schoolers determine the standard deviation of a variety of distributions and interpret its...
Curated OER
Describing Data
Your learners will practice many ways of describing data using coordinate algebra in this unit written to address many Common Core State Standards. Simple examples of different ways to organize data are shared and then practice problems...
Curated OER
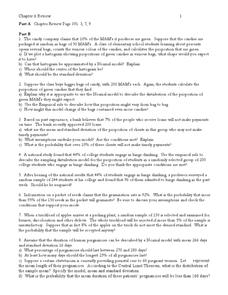
Random Probability
For this statistics and probability worksheet, young statisticians solve and complete 13 different problems related to probability, percentages, and normal distributions. They consider data models, assumptions about the models, and find...
Centre for Innovation in Mathematics Teaching
Ten Data Analysis Activities
This thirteen page data analysis worksheet contains a number of interesting problems regarding statistics. The activities cover the concepts of average measurements, standard deviation, box and whisker plots, quartiles, frequency...
Curated OER
Analytical Problem Solving
Students explore about propagation of error in calculations using experimental data. They develop their weighing and pipetting techniques. Students explore the following terms: Standard deviation and relative standard deviatin. They...
Curated OER
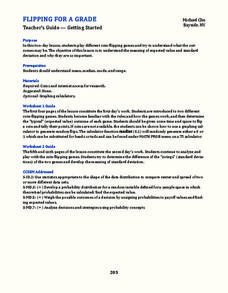
Flipping for a Grade
What happens when your teachers get tired of grading tests and want to use games of chance to determine your grade? How would you decide which game they should play? Learn how to use expected value and standard notation to compare two...
Curated OER
Density of a Paper Clip Lab Review
Even though this assignment is brought to you by Physics Lab Online, it is best used as a math practice. Middle schoolers calculate the range, mean, mode, and median for a list of eight different paper clip densities. They analyze...
Curated OER
The Bell Curve
Learners are introduced to the concepts of the normal curve, skewness and the standard deviation. They discuss how the normal distribution has been used and misused to support conclusions.


