Curated OER
Hypothesis Testing: Claim on Mean; Population Standard Deviation Known
In this standard deviation worksheet, students are given statistical data in a story problem. They use a level of significance to test the claim given by the data. This worksheet contains three problems.
Curated OER
Hypothesis Testing: Claim on Mean; Population Standard Deviation Unknown
In this statistics worksheet, students test given claims using traditional methods of hypothesis testing. Students assume that sampling is randomly generated.
Curated OER
A RealSim Surface Look at Descriptive Statistics
Learners explore the concepts of mean and variance. They observe properties of materials to their basic atomic or molecular structure. Students use spreadsheet software to record, tabulate and analyze collected information.
Curated OER
Using Computers for Statistical Analysis of Weather
Students use temperature, cloud cover and other weather data from the S'COOL website to statistically analyze weather around the country. They use computers to calculate and graph standard deviations, means and modes of the weather...
Wolfram Research
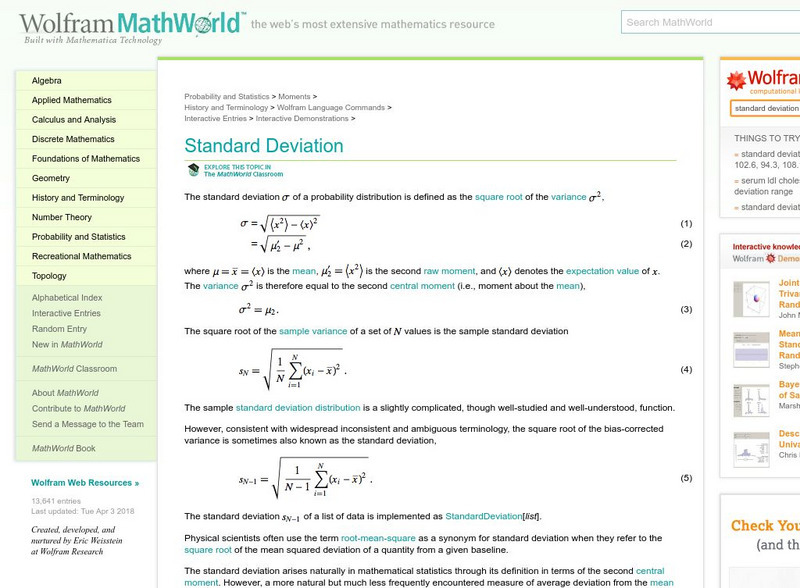
Wolfram Math World: Standard Deviation
This World of Mathematics site by Eric Weisstein explains the term "Standard deviation." Provides step-by-step help, examples, and charts.
Other
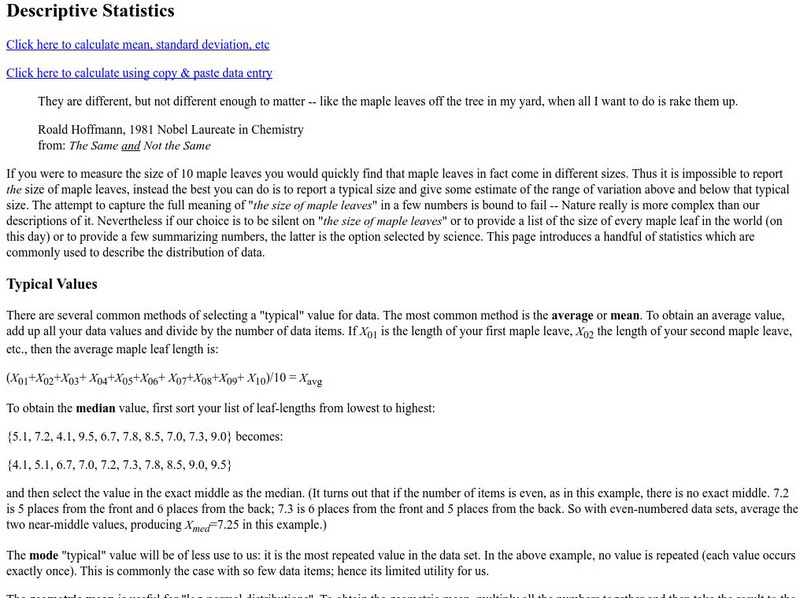
Descriptive Statistics
Very complete explanation of mean, standard deviation, etc. including an online calcluator for these statistics.
Missouri State University
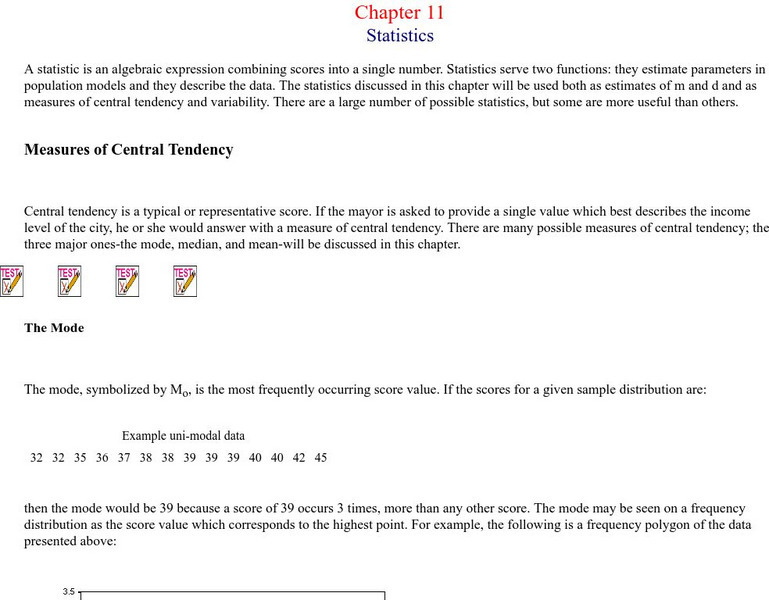
Missouri State University: Introductory Statistics: Statistics
This is an excellent resource on what the science of statistics involves. There are all kinds of definitions, examples, graphs, and charts to learn from. The topics covered include: mode, mean, median, skewed distributions and measures...
Google
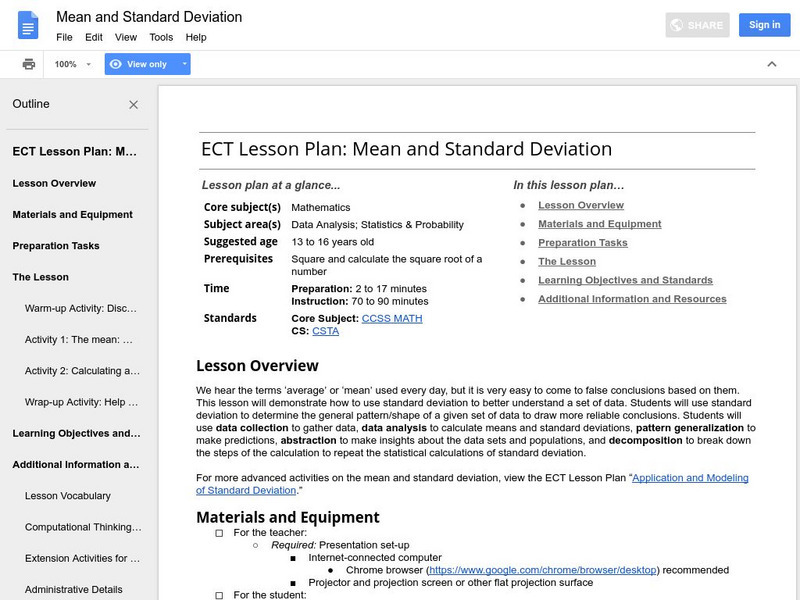
Google for Education: Mean and Standard Deviation
This lesson plan demonstrates to students how to use standard deviation to better understand a set of data. Students use standard deviation to determine the general pattern or shape of a given set of data to draw more reliable conclusions.
Texas Education Agency
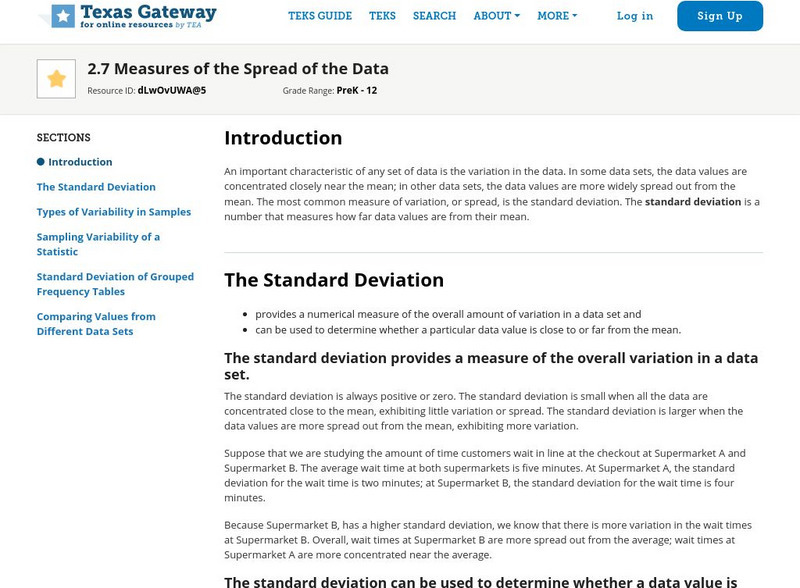
Texas Gateway: Tea Statistics: Measures of the Spread of the Data
This resource explains the different measures of center, variability, etc. that are used to describe the spread of statistical data. Includes examples and practice exercises.
Missouri State University
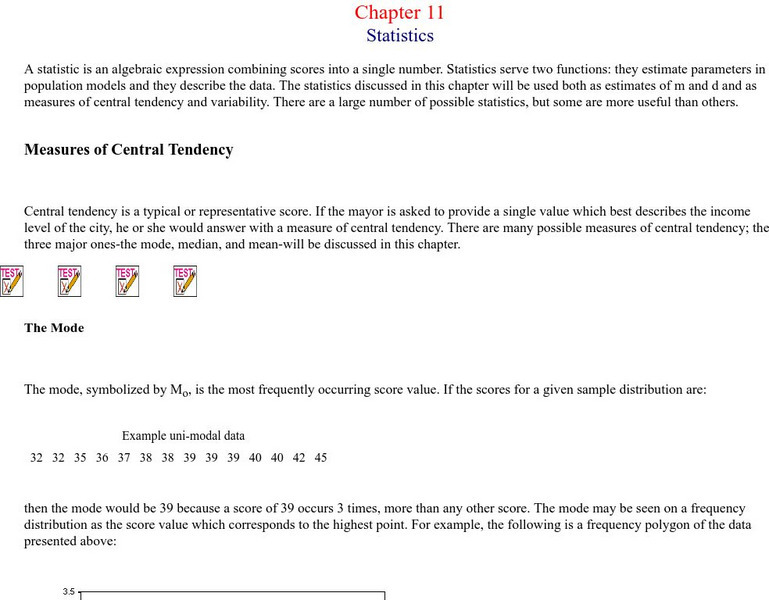
Missouri State University: Introductory Statistics: The Normal Curve
Provides lengthy explanations of the measures of central tendencies - mean, mode, and median - and the measures of variability - range, variance, standard deviation - are given here. Graphs of interesting "side items" are presented as...
Missouri State University
Missouri State U.: Statistics: Measures of Central Tendency and Variability
Provides lengthy explanations of the measures of central tendency - mean, mode, and median - and the measures of variability - range, variance, standard deviation. Graphs of interesting examples are presented as well, skewed...
Khan Academy
Khan Academy: Sampling Distribution of a Sample Proportion Example
Presents a problem that is similar to what might be on an AP Statistics exam. Walks students through each step for solving it and students input answers to questions along the way.
Thinkport Education
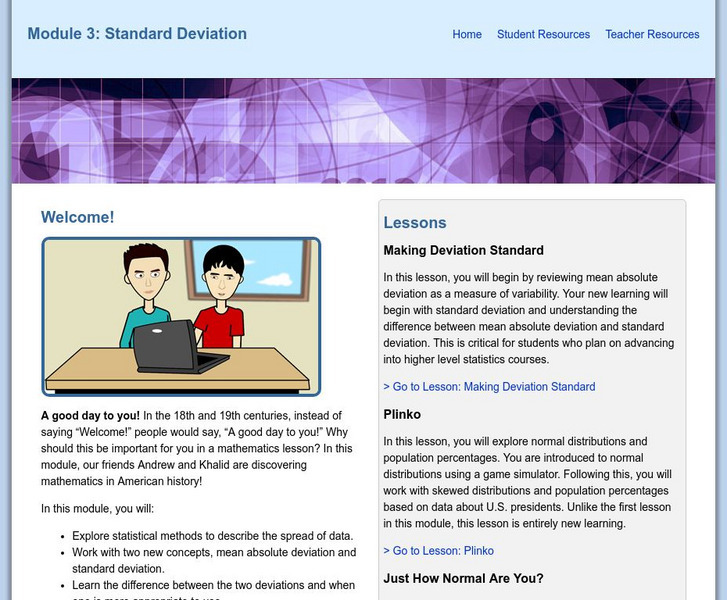
Thinkport: Algebra Ii: Standard Deviation
Begin by reviewing mean absolute deviation as a measure of variability. Your new learning will begin with standard deviation and understanding the difference between mean absolute deviation and standard deviation.
Calculator Soup
Calculator Soup: Descriptive Statistics Calculator
This is a statistics calculator; enter a data set and hit calculate. Descriptive statistics summarize certain aspects of a data set or a population using numeric calculations. Examples of descriptive statistics include: mean, average,...
City University of New York
Measures of Variability
Explanation and examples of variance and standard deviation. Helpful charts and formulas are provided.
Wolfram Research
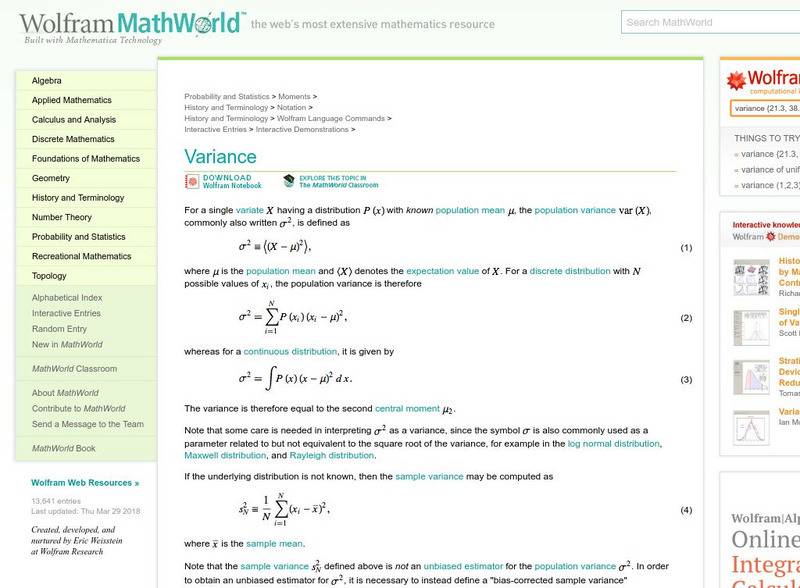
Wolfram Math World: Variance
MathWorld offers a plethora of information on variance. Student should have some statistic knowledge to use this site. This site contains links to related topics.
Texas Instruments
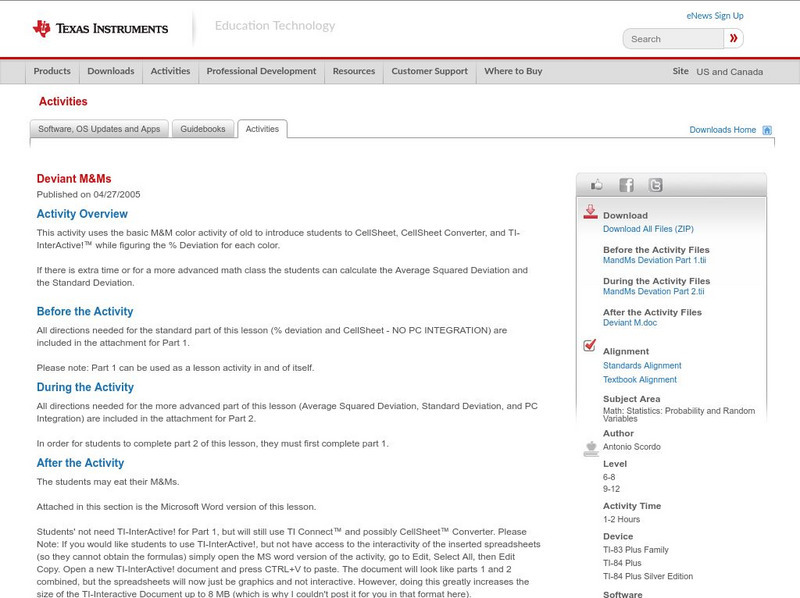
Texas Instruments: Deviant M&ms
This activity uses the basic M&M color activity of old to introduce students to CellSheet, CellSheet Converter, and TI-InterActive! while figuring the % Deviation for each color. If there is extra time or for a more advanced math...
Texas Instruments
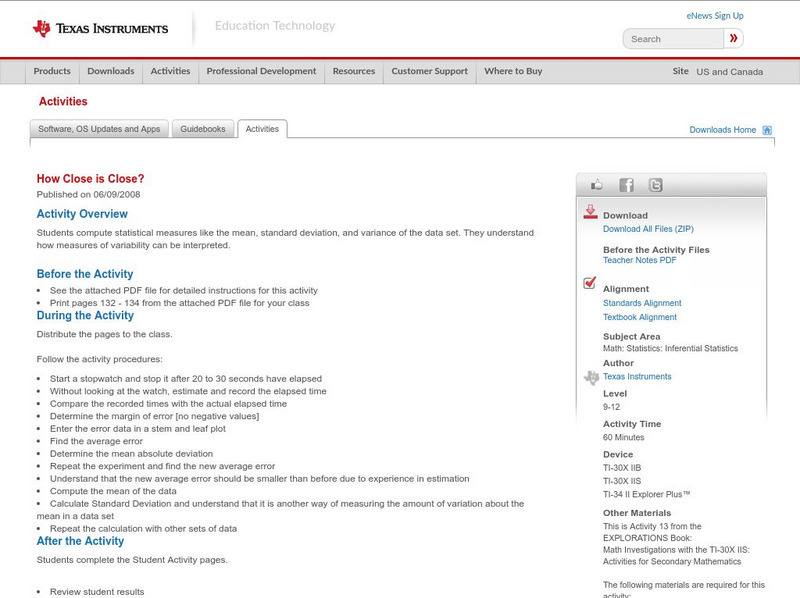
Texas Instruments: How Close Is Close?
In this activity, students compute statistical measures like the mean, standard deviation, and variance of the data set. They understand how measures of variability can be interpreted.
Texas Instruments
Texas Instruments: Simulation of Sampling Distributions
This set contains questions about simulating sampling distributions. Students see graphs of simulated distributions enabling them to reach conclusions about mean, shape, and standard deviation.
Texas Instruments
Texas Instruments: Probability as Relative Frequency
In this activity, students use simulation to justify the concept of the Law of Large Numbers. They understand that as the sample size increases, the relative frequency of which an event occurs approaches the probability of that event...
Science Education Resource Center at Carleton College
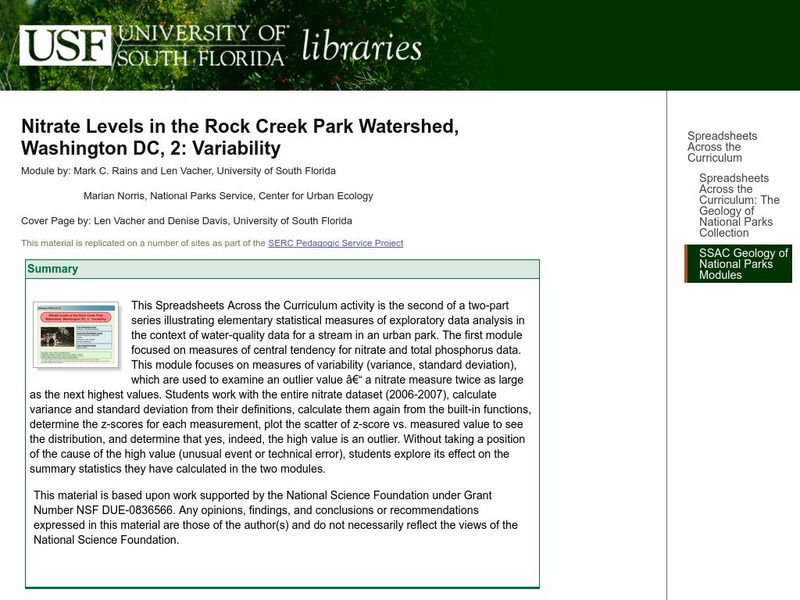
Serc: Nitrate Levels in the Rock Creek Park Watershed: Variability
Learning module focuses on measures of variability such as range, variance, and standard deviation which are used to examine nitrate levels and water quality.
Stefan Warner and Steven R. Costenoble
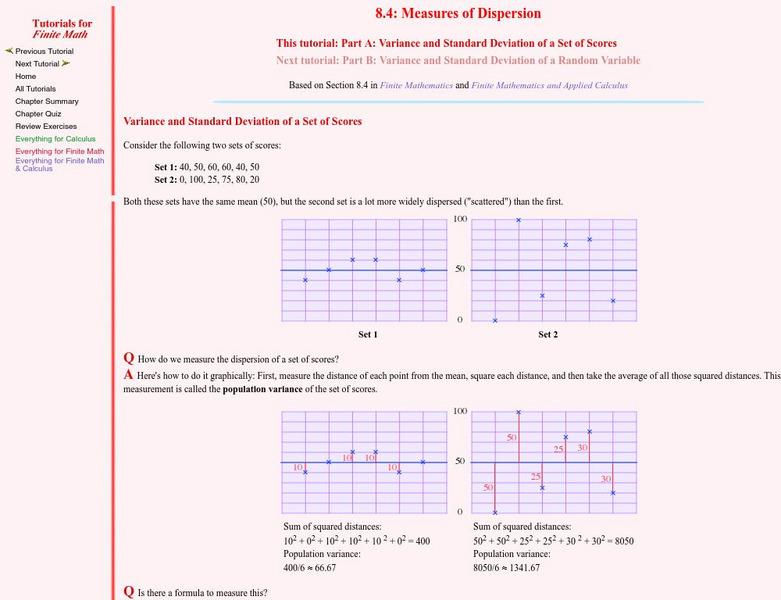
Finite Mathematics & Applied Calculus: Variance and Standard Deviation of a Set of Scores
Students learn about the variance and standard deviation of a set of scores. Topics explored are the empirical rule and Chebyshev's rule. The tutorial investigates the statistics concepts through class notes and examples. Review...
Stefan Warner and Steven R. Costenoble
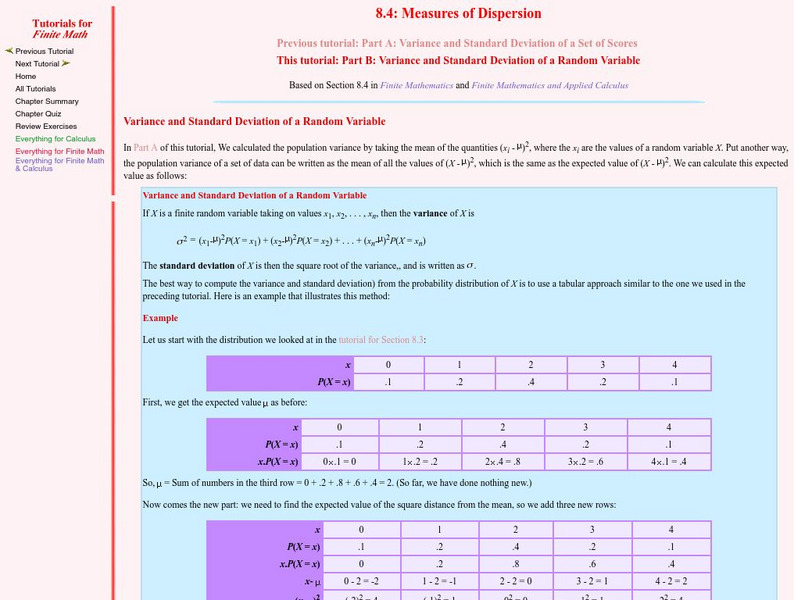
Finite Mathematics & Applied Calculus: Variance and Standard Deviation of a Random Variable
Students learn about the variance and standard deviation of a random variable. The tutorial investigates the statistics concepts through class notes and examples. Review exercises and a chapter quiz are included.
Stefan Warner and Steven R. Costenoble
Finite Mathematics & Applied Calculus: Mean, Median & Standard Deviation
Students learn about mean, median, variance, and standard deviation. The tutorial investigates the statistics concepts though class notes and examples. Review exercises are included.


