Math Is Fun
Math Is Fun: Standard Deviation Calculator
How to find the standard deviation is explained and demonstrated with this calculator. Reloading the page presents you with new numbers.
Oswego City School District
Regents Exam Prep Center: Statistical Studies, Central Tendency, and Dispersion
The mathematics tutorial investigates statistical studies, central tendency, and dispersion. The lesson consists of class notes, calculator tips, examples, and practice problems with solutions. The teacher resource includes an activity...
Other
Online Statistics Education: Measures of Variability
Learning Objectives cover the areas of the Measures of Variability. Explanations are given for: variability, range, interquartile range, variance, and standard deviation. Examples and quizzes are also provided.
Other
Stat Soft: Statistics Glossary
Dozens of statistical terms are defined and illustrated in this glossary.
McGraw Hill
Glencoe: Online Study Tool: Quiz on Measures of Variability
Students demonstrate advanced mathematics skills with this online quiz. The questions check understanding on measures of variability. Topics include variance, standard deviation, and frequency tables.
Science Education Resource Center at Carleton College
Serc: Understanding the Standard Deviation: What Makes It Larger or Smaller?
Students develop a better intuitive understanding of what is meant by variability in statistics. Emphasis is placed on the standard deviation as a measure of variability.
CK-12 Foundation
Ck 12: Statistics: Applications of Variance and Standard Deviation
[Free Registration/Login may be required to access all resource tools.] Calculate the variance and standard deviation of a data set.
Khan Academy
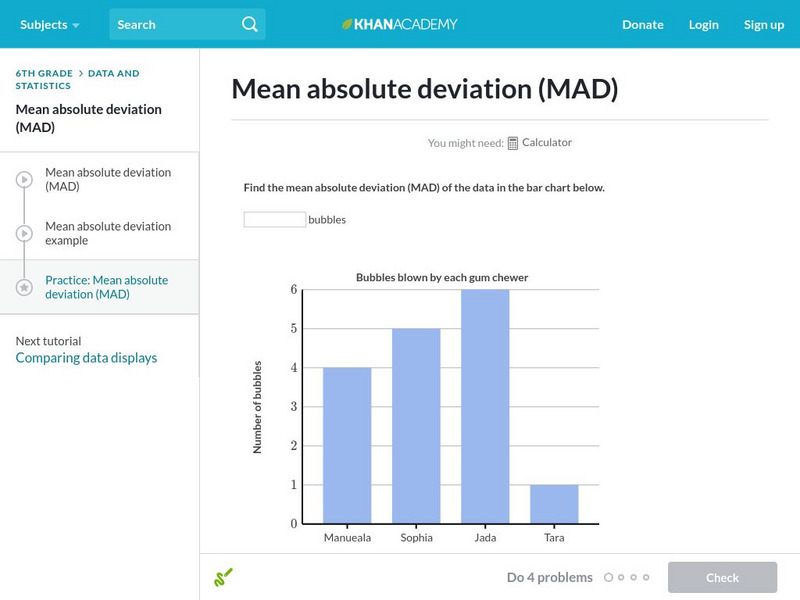
Khan Academy: Mean Absolute Deviation (Mad)
Practice calculating the mean absolute deviation.
Math Is Fun
Math Is Fun: Standard Deviation and Variance
Standard devaition and variance are explained clearly, accompanied by an examples using the size of dogs.
Sophia Learning
Sophia: Practical Applications of the Bell Shaped Curve
Explore the bell-shaped curve and how to calculate a z score. Additional links provided to further knowledge on outliers.
Sophia Learning
Sophia: Standard Deviation
Students learn how to calculate the standard deviation by hand. Detailed examples that explore how to use the standard deviation formula are included.
Other
Vlps: Mean and Standard Deviation
Explanation of frequency distributions, mean, standard deviations, and variance including a Java Applet.
Michigan Technological University
Computing Mean, Variance and Standard Deviation
Page centered around a computer program to determine mean, variance, and standard deviation.
Khan Academy
Khan Academy: Empirical Rule
Practice applying the 68-95-99.7 empirical rule. Students receive immediate feedback and have the opportunity to try questions repeatedly, watch a video or receive hints.
Khan Academy
Khan Academy: Z Scores 1
Find the z-score of a particular measurement given the mean and standard deviation. Students receive immediate feedback and have the opportunity to try questions repeatedly, watch a video or receive hints.
Math Planet
Math Planet: Algebra 2: Standard Deviation and Normal Distribution
Gain an understanding of standard deviation and normal distribution by viewing an example and a video lesson.
Khan Academy
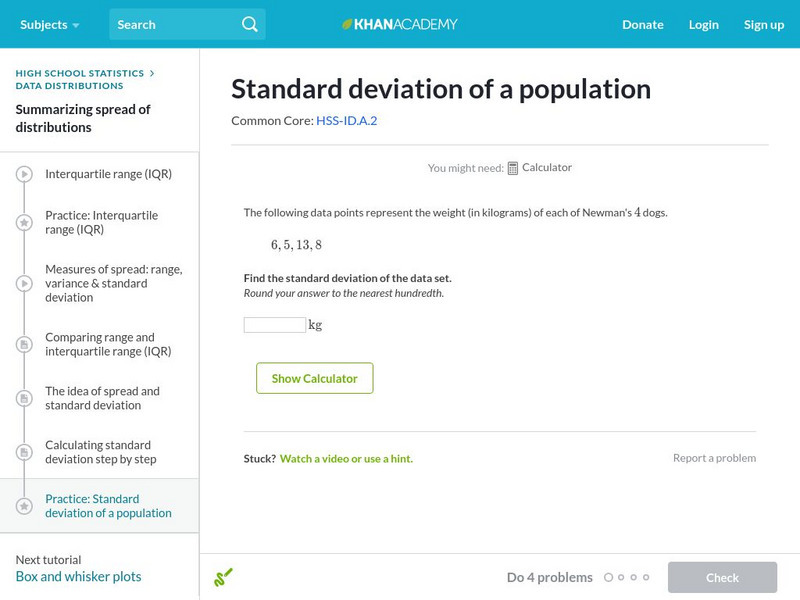
Khan Academy: Standard Deviation of a Population
Calculate the standard deviation of a population. Students receive immediate feedback and have the opportunity to try questions repeatedly, watch a video or receive hints.
University of Illinois
University of Illinois: Mste: How Much Do Baseball Players Really Make?
An interesting real-world use of statistical variance and standard deviation to help dispell the common perception that all major league baseball players are paid millions of dollars and are not worth it. The lesson plan gives specific...
Texas Instruments
Texas Instruments: Spread Out #1
This exploration uses baseball's slugging average to explore variance and standard deviation.
Illustrative Mathematics
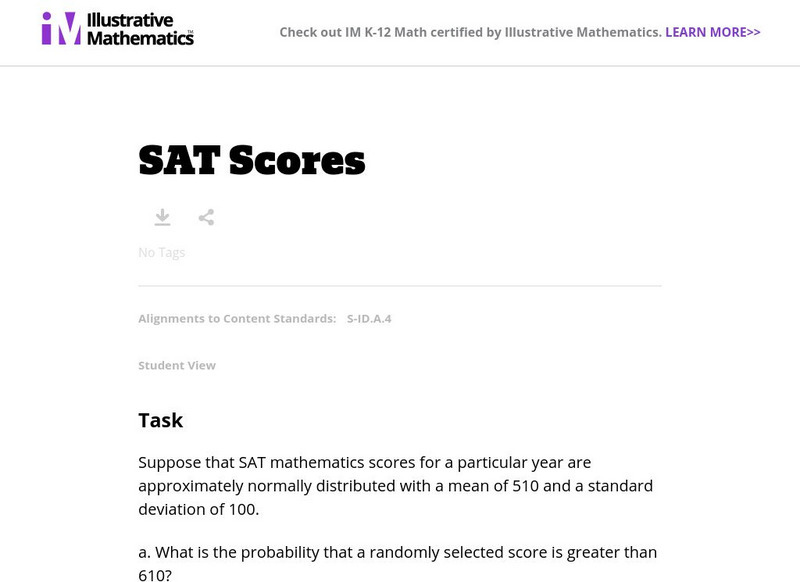
Illustrative Mathematics: S Id Sat Scores
Young scholars will find solutions for a series of questions based on the assumption that SAT mathematics scores for a particular year are approximately normally distributed with a mean of 510 and a standard deviation of 100. Explanation...
Illustrative Mathematics
Illustrative Mathematics: Understanding the Standard Deviation
The purpose of this task is to deepen student understanding of the standard deviation as a measure of variability in data distribution. The task is divided into four parts, each of which asks students to think about standard deviation in...
Illustrative Mathematics
Illustrative Mathematics: S Id.4 Do You Fit in This Car?
Students are tasked with solving a common issue for automobile manufacturers that require the students to use normal distribution as a model for data distribution. They will also use mean and standard deviation to figure out the problem....
Illustrative Mathematics
Illustrative Mathematics: S Id.4 Should We Send Out a Certificate?
Should Fred receive a certificate for scoring in the top 2.5% of a statewide standardized test? Given the test scores for a large population and the mean and standard deviation, students will decide if Fred's score is good enough....
Illustrative Mathematics
Illustrative Mathematics: Measuring Variability in a Data Set
The purpose of this student task is to develop understanding of standard deviation. Aligns with S-ID.A.2 and S-ID.A.3.


