Curated OER
Statistics
In this statistics worksheet, 9th graders solve and complete 10 various types of problems that include using different types of graphs to illustrate data. First, they determine the median score for each stem-and-leaf plot. Then, students...
Math Mammoth
Stem-and-Leaf Plots 3
In this stem-and-leaf instructional activity, students place statistical data in a stem-and-leaf plot. They identify the median, and range in a given set of data. There are four multi-step problems on this one-page instructional activity.
Curated OER
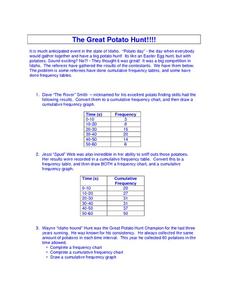
The Great Potato Hunt
In this science worksheet, students examine the data from the potato hunt where potatoes are found like Easter Eggs. The data of the number of potatoes found is recorded in the frequency tables.
Curated OER
Finding Domain and Range
In this domain and range worksheet, students observe a graph and identify the domain and range of given functions. Afterwards, they solve functions to identify the range. Fifteen problems are provided on this one-page worksheet.
Curated OER
Recycling Statistics
In this environment worksheet, students look for the answers to the environmental impact of recycling in Great Britain with the statistics from the pie graph.
Curated OER
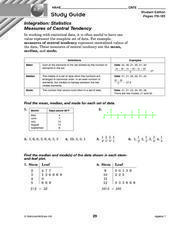
Integration: Statistics
In this math worksheet, students find the mean, median and mode for 6 number sets. Students then find the median and mode for data found in 2 stem-and-leaf plots.
Curated OER
Party Time
Students engage in a lesson about finding information from the grocery store to put into data that can be measured. The data is found in advertisements and food labels. They plan the cost of a party when using the unit cost of various...
Curated OER
Population Pyramids
Students engage in a lesson that is about the concept of measuring the statistical data of a population taken from a census. The data is interpreted and recorded looking for trends in subjects like world economy and job opportunities.
Curated OER
Statistical Process Control
Students brainstorm items they have that use memory and view Statistical Process Control PowerPoint presentation. They complete Statistical Process Control Simulation/experiment then find the average, range and standard deviation in...
Curated OER
Something Fishy (Statistics)
Students are introduced to a problem involving an environmental issue. They are introduced to the capture-recapture method which involves capturing fish, tagging them, returning them and recapturing another sample. Pupils work in...
Curated OER
How Many Is Too Many?
Students explore the population explosion. They view a video depicting the exponential growth of human population. Students research the internet to project future population data. They perform hands-on, multimedia activities to study...
Curated OER
Penny's Pizza
Students develop a list of possible outcomes as a method of finding probability related to a pizza statistics problems. They read the problems together as a class, brainstorm ways to solve the problem, and in partners solve the pizza...
Curated OER
What's the Matter with My Snow?
Students collect snow samples around their school. They explore the concepts of density and phase change as well as the math skills of measurement and statistics. Students explore the water cycle through an interactive, down loadable...
Curated OER
What Color Are Your Skittles?
Students create spreadsheets and manipulate data. They collect data, create appropriate graphs and use percentages to describe quantities. Students compare and contrast data. They use spreadsheets to generate a pie chart.
Curated OER
Observing M&M Colors: A Multinomial Experiment
Students use hands-on activities to study statistics. They review the chi-square distribution and expected value. Activities involve discovering calculation a hypothesis, frequency distribution, and probability.
Curated OER
Cyber Chow Combos
Students, after watching the CYBERCHASE episode, "A Day at the Spa,"represent and count combinations of choices using tree diagrams.
Curated OER
Roundball for Remembrance
Students view a segment of Futures With Jaime Escalante showing the application of math in basketball, and they try to find some of these applications in a tape of a game played by their home school. This fun lesson should be very...
Curated OER
A Statistical Study of the Alphabet
Students determine probability by completing statistical study on letters of the alphabet and comparing and contrasting results.
Curated OER
Make That Shot!
Students figure out basic percentages by shooting paper balls into a basket, recording results, and calculating individual and team percentages for ten shots.
Curated OER
Graphing the Past Using Today's Technology
Eighth graders research statistical data regarding their current social studies unit. They write questions about the measures of central tendency, collect and analyze the data, insert the data into a spreadsheet, and generate graphs.
Curated OER
Determining Mean, Range, Median, Mode, and Probability
Students calculate mean, median, range, mode and probability. Then, working in teams, they use data from their workplace to compute values for these terms. Finally the class explores the term "probability" using a die.
Curated OER
Designing Detectives
Third graders explore the idea of formulating a hypothesis and designing an experiment to test the hypothesis.
Curated OER
Baseball Stats
Students explore data sets and statistics in baseball. They use baseball data available on the Internet to develop an understanding of different ways in which data can be analyzed. They access the Baseball Archive Website to do more...
Curated OER
First Class First? Using Data to Explore the Tragedy of the Titanic
Students analyze and interpret data related to the crew and passengers of the Titanic. They research information on a Titanic database to illustrate specific statistical conclusions, and whether or not social status affected the outcome.


