Curated OER
Pie Charts
In this math worksheet, students complete the work in order to chart the data into the pie graph. The picture is used for statistical analysis.
Curated OER
Coral Reef Center Math
In this math worksheet, students find the solutions to the math problems with the use of the graphs using the theme of coral reefs.
Curated OER
Pie Chart
In this literacy worksheet, students use the created resources for further progress towards knowledge. The sheet is a teacher's guide for creating student resources.
Curated OER
School Population
In this math activity, students solve the problem of creating ratios for the school population. There is an example on page 1.
Curated OER
Seasonal Graphs
In this math learning exercise, students create a graph using the data recorded from the local newspaper concerning local temperatures.
Curated OER
The Color of M and M's
In this math worksheet, students sort out the colors of candies. Then they count each color and create a flowchart. Finally they create a ratio for each color in comparison to the total number of candies.
Curated OER
Dollar Data
In this math worksheet, students examine a dollar bill in great detail. They record the facts in a data table and then give an oral report of the findings.
Curated OER
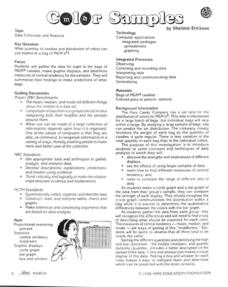
Colors Samples
In this math learning exercise, students take the time to count out the colors of the candies. They graph the results and make inferences from the information.
Curated OER
The Two Coin Problem
In this math worksheet, middle schoolers look for the answers to the 17 applications of looking at the outcomes of flipping two coins. They also graph the results.
Curated OER
Family Size
In this family size worksheet, students complete a tally chart to determine data from a family size line plot. They organize the data in the chart to determine the mean, median, mode, and range of the data. There are six problems in...
Curated OER
Food Probability
In this math worksheet, students plot the possibilities of outcomes for making sandwiches and ice cream in the graphic organizers.
Curated OER
Possible Outcomes
In this statistics worksheet, students plot the possible statistical outcomes by examining the data and plotting the missing answer for the four problems.
Curated OER
"M&M's"® Candies Worksheet 2
In this math worksheet, students plot the mean, median, and mode for the colors of M and M candies by filling in the graphic organizer.
Curated OER
Collecting and Organizing Data
Fifth graders explore methods of generating and organizing data. Afterward, they visit a specified website where they analyze data, organize, and create graphs. Students follow instructions and complete answers to questions. They...
Curated OER
Getting To School: Loving It Or Loathe It?
Students engage in a study looking at the problem of transportation to school. They conduct research using a variety of resources. The information is used in order to work together to come up with possible solutions based upon current...
Curated OER
Doing The School Run
Learners explore finding the percent of a numbers. They survey their peers to determine modes of transportation used in getting to school. Afterward, students organize information and create graphs and charts. They explore alternative...
Curated OER
Getting A Grip On Graphs
Fourth graders investigate the concept of graphing and comparing different types of data using pictographs, line graphs, scatter plots, etc... They gather data and make interpretations while examining the medium of how it is displayed.
Curated OER
Candy Bar Survey
Second graders investigate the skill of graphing data by using candy bars to create context for the instructional activity. They use technology for graphing and organizing information like a spreadsheet. The instructional activity...
Curated OER
Sustainability: Our Environment
Students explore the sustainability of our environment, the trend in rising temperatures and the emission of greenhouse cases. Using given data, students test and construct a confidence interval and the difference between two population...
Curated OER
Bringing Statistics Alive
Learners compute mean, median and mode and compare mean, median and mode to a real-world application to identify their practical uses. They apply mean, median and mode to real-world statistical data. Finally, students organize data into...
Curated OER
Great Tasting Shapes
Fifth graders investigate the concept of median, mode, and range using a simple model for display purposes. They examine different shaped crackers out of a box and identify the ones that occur the most. Then the calculations for the...
Curated OER
Probability Two Events
Students investigating the concept of probability practice the concept using a variety of different example problems. The lesson is delivered in a question and answer format. The frequency of answers is recorded in a data table for...
Curated OER
Probability Of One Event
Middle schoolers investigate the concept of probability. They use example problems in order to measure the likelihood of various outcomes. The lesson plan includes dialogue to be used by the teacher during direct instruction. They also...
Curated OER
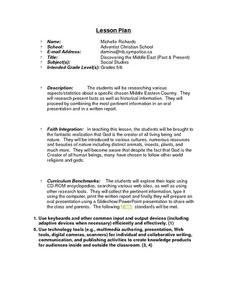
Discovering the Middle East (Past & Present)
Pupils, after being assigned a specific Middle Eastern Country, research various aspects/statistics as well as historical information on their country. They combine their acquired information in an oral presentation and written report....


