Curated OER
Probability Two Events
Students investigating the concept of probability practice the concept using a variety of different example problems. The instructional activity is delivered in a question and answer format. The frequency of answers is recorded in a data...
Curated OER
Probability Of One Event
Learners investigate the concept of probability. They use example problems in order to measure the likelihood of various outcomes. The lesson includes dialogue to be used by the teacher during direct instruction. They also use class...
Curated OER
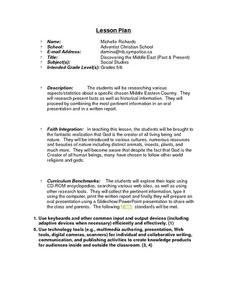
Discovering the Middle East (Past & Present)
Students, after being assigned a specific Middle Eastern Country, research various aspects/statistics as well as historical information on their country. They combine their acquired information in an oral presentation and written report....
Curated OER
Significant Science: Statistics for Planet Earth
Ninth graders discover how statistics are used to interpret results of scientific experiments. Students write hypotheses and test the hypotheses by collecting data and organizing the data. Students graph their data to produce a visual....
Curated OER
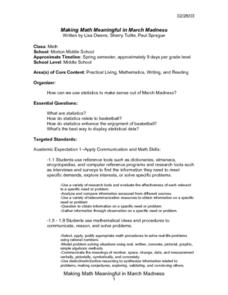
Making Math Meaningful in March Madness
Middle schoolers examine the statistics of March Madness, the college basketball tournament. They watch videotaped basketball games to collect data for further analysis using Word and Excel. They analyze the data in a variety of...
Curated OER
Classmate Pictograph
Students create pictographs using their classmates in this technology-based lesson plan. The lesson plan uses Inspiration, or Kidspiration, digital cameras, and a downloadable pictograph template.
Curated OER
The Survey Says
Young scholars experience the development of statistical data. In groups, they construct a survey questionnaire for a target audience. Students produce the questionnaire, distribute it, collect it, and tabulate the data. Using EXCEL,...
Curated OER
Vote for Me!
Tenth graders analyze voter trends in South Carolina and discover techniques canddidates and their parties use to convince us to vote their way. They are able to locate voting statistics for their county; compare the number of...
Curated OER
Financial Planning
Students participate in activities in order to apply the skills of sound financial planning that includes creating and maintaining a budget. The lesson is intended for diverse learners because of the application of The Multiple...
Curated OER
What is Probability?
Learners participate in a variety of activities in order to understand the concept of probability. The students are engaged because of the application of The Multiple Intelligences Theory.
Curated OER
Fair Games
Students participate in several chance activities and examine a few games for fairness. They become game designers who are asked to design a fair game for a toy company. Students must describe the rules for play and examine...
Curated OER
Graphing Population Around the World
Students define specific vocabulary necessary for understanding population data. They collect, analyze, and interpret specific data. They utilize computer programs in order to create graphs of collected data.
Curated OER
Party, Party, Party
Second graders conduct investigations with counting, comparing, organizing, analyzing, displaying and interpreting data. They pose questions for investigation and collect the data. Students display the data in tally charts, uniform...
Curated OER
Bias in Statistics
Students work to develop surveys and collect data. They display the data using circle graphs, histograms, box and whisker plots, and scatter plots. Students use multimedia tools to develop a visual presentation to display their data.
Curated OER
Analysis of Grooming Behavior in Drosophila melanogaster
Young scholars engage in a lab that focuses on animal behavior in an open ended inquiry based laboratory experience. They build an ethogram, display a transition matrix and analyze a Markov Chain. They remove wings from the drosophila...
Curated OER
A Statistical Look at Jewish History
Students complete their examination over the Jewish Diaspora. Using population figures, they discover the importance of percentages in exploring trends. They use their own ethnic group and determine how it is represented in the United...
Curated OER
Mr. Cobbler's Shoe Dilemma
Students employ statistics to solve real-world problems. They collect, organize and describe data. They make inferences based on data analysis. They construct, read, and interpret tables, charts and graphs.
Curated OER
Fantasy Baseball Team
Students create a database and use its ability to store, sort, and present information about their fantasy baseball team. They gather information and use their knowledge of statistics to accomplish their team.
Curated OER
A Data Processing Lesson for Statistics -- Reading a Table or Chart
Students identify the structure and key parts of tables and charts. They determine which data is meanjngful and make comparisons with the data. They describe the scope of the AIDS plague throughout the world.
Curated OER
Graphing Made Easy
Fourth graders discover the appropriate way to construct and analyze bar, line, picto, and circle graphs. They set up frequency tables and perform some statistical analysis (mean, median, and mode) on their data.
Curated OER
Popcorn Nutrition
Students read a snack nutrition chart and answer questions. They compare nutrition levels of snack foods. They correctly calculate differences in nutritional value.
Curated OER
Being an Educated Consumer of Statistics
Students examine kinds of data used to report statistics, and create their own statistical report based on any of the four sources of media information (Internet, newspaper, TV, magazine).
Curated OER
What's Math Got To Do With It?
Students explore numbers, computation, ratios, proportions, probabilities, statistics, and money in this six lessons unit. Practical applications in the real world are emphasized through an interactive approach to math in these lessons.
Curated OER
Gender Equity in the Classroom
Young scholars review employment statistics and wages over the past 20 years. They examine the Federal Work Force Laws. They apply formulas to find the rate of change in the minimum wage.


