Curated OER
Statistics and Shopping
Students examine statistics and data analysis concepts from the practical questions that arise in everyday life.
Curated OER
Neighborhood statistics
Students examine statistics relating to neighborhoods. They use the data to explain how a population affects their environment. They discuss how businesses use statistics to find out information about their clientele.
Curated OER
Mapping the changes in Canada's population
High schoolers find and analyze data found in the census. They compare the population from 1996 to 2001. They explore the type of data they can find in the Census of Population.
Curated OER
The Household Environment Survey
Students examine data collected from a national survey of household environmental practices to develop their own questionaires. Once they have their own survey questions, students conduct their own investigations, and report their findings.
Curated OER
Distribution of children living at home
Students examine census data to evaluate the number of students of certain ages living at home. This data is then used to determine the need for day care, or other social programs. They use this information to explore social policies.
Curated OER
Successful Resource-based Learning Strategies for the Geography of Canada Course
Students conduct a statistical research project on population changes. They evaluate demographic issues, such as the size and location of native people. immigrant groups, and the age and gender of the population.
City University of New York
Scientific Method and Probability: Interactive Activity
This interactive lesson begins with the basics and carries through to methods of data analysis, all interactively. Supporting material is excellent.
Mathematics Archives
Math Archives: Linear Equation Programs
This site contains a downloadable tool that can solve up to 30 simultaneous linear equations in 30 unknowns.
Massachusetts Institute of Technology
Mit: Open Course Ware: Introduction to Probability and Statistics
The online course consists of educational materials about probability and statistics. Lecture notes, exams, and assignments are included.
University of South Florida
Fcat: Drops on a Penny: Teacher Notes
Young scholars learn how to create stem-and-leaf diagrams and boxplots by collecting data on the surface tension of water molecules. This hands-on activity using pennies is a great way to learn how to organize data.
Science Buddies
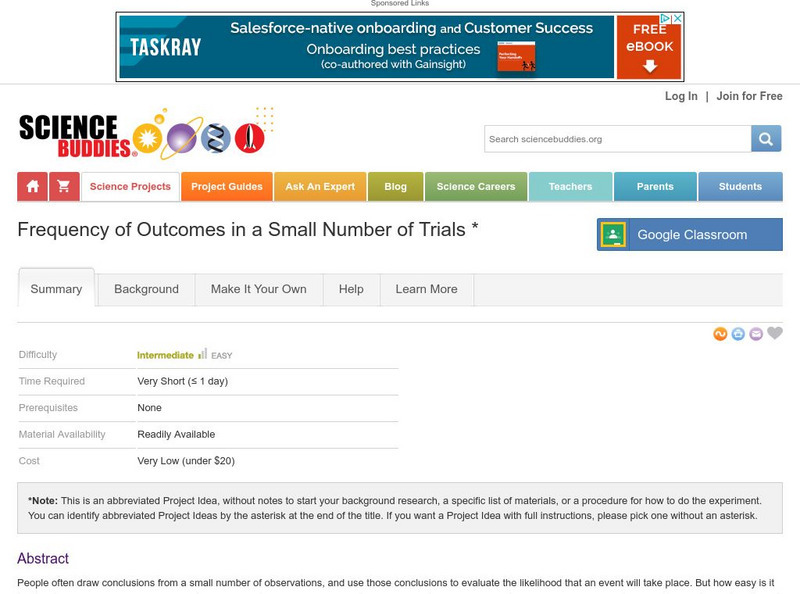
Science Buddies: Frequency of Outcomes in a Small Number of Trials
People often draw conclusions from a small number of observations, but how easy is it to draw the wrong conclusion? Here is a simple project that shows the importance of making enough observations before making a prediction.
University of Texas at Austin
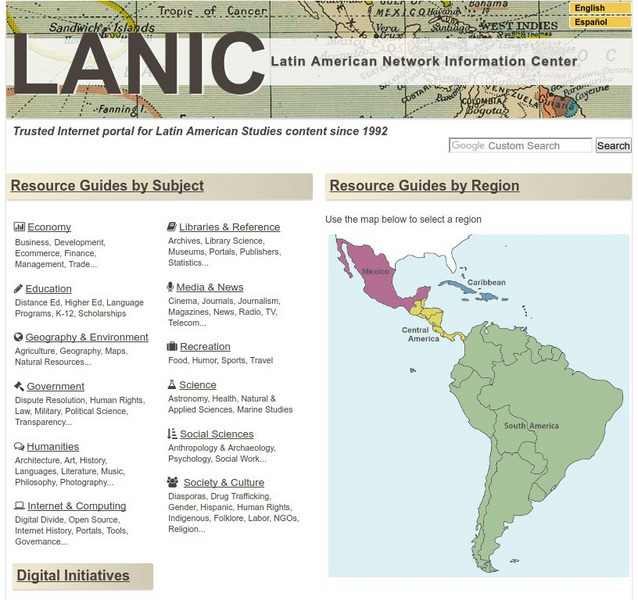
Lanic: Latin American Network Information Center
Vast network of information from and about Latin America is provided. Major topic headings include countries, economy, education, government, humanities, science, social sciences, society and culture, recreation, media and communication,...
Environmental Education for Kids
Eek!: Canada Goose
Read all about Canadian geese at this fun and interesting site! What do Canadian geese look like? How do they behave? Where do they live? Learn the answers to all of these questions, and more!
Science Buddies
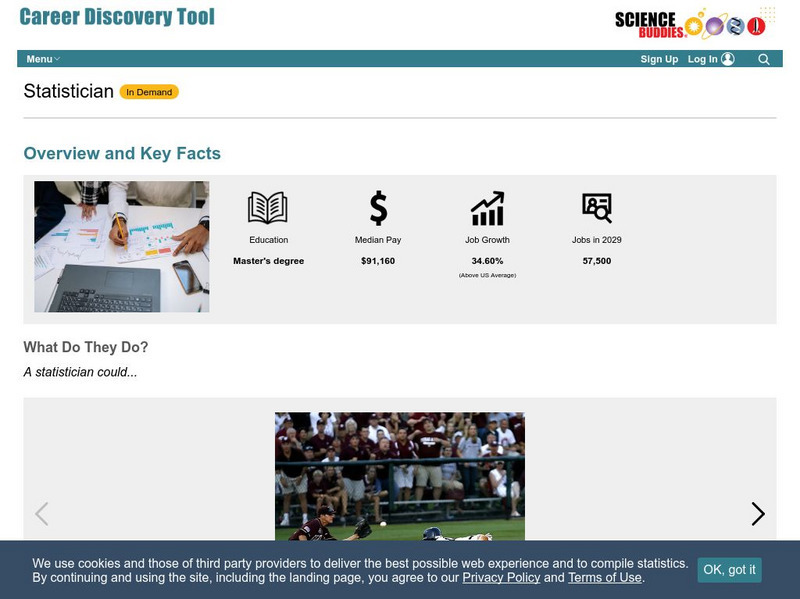
Science Buddies: Career Profile: Statistician
Statistics is a fascinating subject and everyone loves to spout them, but a statistician really knows how to use statistics to answer real-life questions and make predictions based on mathematical data. This Science Buddies site lays out...
University of Colorado
University of Colorado: Ph Et Interactive Simulations: Plinko Probability
Play Plinko and develop your knowledge of statistics. Drops balls through a triangular grid of pegs and see the balls random walk through the lattice. Watch the histogram of final positions build up and approach the binomial distribution.
Science Buddies
Science Buddies: Dice Probabilities
You're playing Monopoly with a friend, and you've already got Park Place and you really, really want to get Boardwalk. If you're on Pacific Avenue, what are the chances you'll reach your goal? Here's an easy project that will show you...
Science Buddies
Science Buddies: The Birthday Paradox
This project shows how mathematical probability sometimes contradicts our intuition. Despite the fact that there are 365 days in a year, if you survey a random group of just 23 people there is a 50:50 chance that two of them will have...
Science Buddies
Science Buddies: Estimation and Population Size
Have you ever wanted to take a short cut? How about when doing your math homework? In this experiment you can learn how estimation can save you time doing math calculations. But beware, some estimations are better than others. Can you...
Science Buddies
Science Buddies: M&m Math
By using a simple bag of M&Ms, you can conduct an experiment in statistics to determine the frequency of colors in the package. The Science Buddies project ideas are set up consistently beginning with an abstract, objective, and...
Science Buddies
Science Buddies: Getting More Out of Less : Google Hits and Search Terms
Google is the name of the most often used search engine on the Internet. "Googol" is the mathematical term for a 1 followed by 100 zeros. It's a very large number. This experiment will help you test different search terms and find out.
Science Buddies
Science Buddies: Fast Food: Can Peppermint Improve Reaction Times?
Did you know that some teachers give their students a peppermint candy on state testing days? Is it to give the kids sweet-smelling breath? Or are the teachers hoping for something more on the important testing day? In this human biology...
Estrella Mountain Community College
Estrella Mountian College: Introduction to Genetics
This site explains genetic beliefs before and after Mendel, and also includes a section on Mendel himself and his experiments, entitled, "The Monk and his Peas".
Rice University
Hyper Stat Online Statistics Textbook
Many people cringe at the idea of studying statistics, but it doesn't have to be impossible! David M. Lane, Associate Professor of Psychology, Statistics, and Management at Rice University, offers a large collection of resources for the...
University of Colorado
University of Colorado: Ph Et Interactive Simulations: Plinko Probability
Drop balls through a triangular grid of pegs and see them accumulate in containers. Switch to a histogram view and compare the distribution of balls to an ideal binomial distribution. Adjust the binomial probability and develop your...


