College Board
2010 AP® Statistics Free-Response Questions Form B
Form a good familiarity with the AP® test using Form B of the 2010 AP® Statistics free-response questions. Pupils use a test from a previous administration to prepare for their exams. A set of six questions assesses box plots,...
College Board
2010 AP® Statistics Free-Response Questions
Familiarity with the AP® exam is highly beneficial for test-takers. Scholars use the 2010 AP® Statistics free-response questions familiarize themselves with the test content and format. Studies and experiments, linear regression,...
College Board
2011 AP® Statistics Free-Response Questions Form B
Is the sequel better than the original? The 2011 AP® Statistics free-response questions, Form B, is available for instructors to reference. Among the topics covered in the exam are histograms, distributions, studies and experiments,...
College Board
2011 AP® Statistics Free-Response Questions
Familiarize yourself with the AP® exam by looking at past tests. A PDF file provides the 2011 AP® Statistics free-response questions. The questions include topics such as mean, standard deviation, conditional probability, sampling...
College Board
2012 AP® Statistics Free-Response Questions
There's no better way to prepare your class for the AP® test format than previous exams. Instructors and scholars use the 2012 AP® Statistics free-response questions to familiarize themselves with the test. Topics covered in the exam...
College Board
2013 AP® Statistics Free-Response Questions
AP® exams don't need to be shrouded in mystery. The 2013 AP® Statistics free-response questions are available for instructors to reference. It includes questions on mean, standard deviation, normal distribution, confidence intervals,...
College Board
Random Variables vs. Algebraic Variables
Variables can vary in meaning. A reference material for AP® Statistics explains the difference between random and algebraic variables. It provides a hypothetical situation involving dice—great for use in a classroom situation.
College Board
Power in Tests of Significance
Test your knowledge of tests of significance. A curriculum model for AP® Statistics describes and defines power in terms of tests of significance. It also provides two classroom activities designed to investigate power and how it relates...
College Board
Coke® Versus Pepsi®: An Introductory Activity for Test of Significance
Most people claim they can tell the difference between Coke and Pepsi. Scholars conduct a fun experiment to test that claim! Once learners collect their data, they analyze the results and determine if the statistics are significant.
College Board
Special Focus: Inference
Statistics is all about making inferences! A lesson guide explains the meaning of inferences and how to use statistics to make them. The resource provides instruction as well as information about the topic on the AP® Statistics exam.
College Board
2003 AP® Psychology Free-Response Questions
Intelligence testing can be a useful tool—but what are its limits? Scholars explore the question, considering issues such as the role of bias, using authentic College Board materials. Learners also examine the psychological factors...
College Board
2011 AP® Psychology Free-Response Questions
A student is taking her first exam in Japanese. What are some factors that could affect her success? Learners consider the question, as well as examine a study on vision and feedback using authentic College Board materials.
College Board
2004 AP® Psychology Free-Response Questions
Time influences mental health and behavior, but how? Learners explore the topic with authentic College Board materials. Using another scenario, scholars consider the various research methods used to explore the connection between stress...
CCSS Math Activities
Smarter Balanced Sample Items: 7th Grade Math – Target H
Not one but two box plots. How will your pupils fare? Assess their understanding of box plots by having them compare two populations. The eighth of nine installments in the Gr. 7 Claim 1 Item Slide Shows series, the resource has them...
CCSS Math Activities
Smarter Balanced Sample Items: 7th Grade Math – Target G
Don't leave learning to chance! Assess your class's understanding of random sampling and making inferences using questions from the experts at Smarter Balanced. As the seventh of nine parts in the Gr. 7 Claim 1 Item Slide Shows series,...
PBS
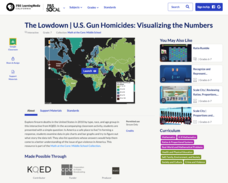
The Lowdown — U.S. Gun Homicides: Visualizing the Numbers
Is gun violence a big issue in America? Pupils explore gun deaths by type, race, and age group in a Math at the Core: Ratios interactive. The class tries to determine whether America is a safe place to live and use bar graphs and pie...
Howard Hughes Medical Institute
Evolution in Action: Data Analysis
An environmental factor, such as a drought, sometimes speeds up the rate of natural selection. Scholars analyze data on the beaks of birds around the time of the drought. They compare those that survived to those that perished and find...
Howard Hughes Medical Institute
Using Genetic Crosses to Analyze a Stickleback Trait
Two fish appear different, but how do scientists determine their genotypes? Scholars practice performing test crosses to determine the genotypes of fish given their phenotypes. They answer in-depth comprehension questions and complete...
Howard Hughes Medical Institute
Mendelian Genetics, Probability, Pedigree, and Chi-Square Statistics
People with the sickle cell trait, but not sickle cell disease, find natural protection against malaria. Scholars consider various combinations of genotypes and environmental factors to determine if children might have sickle cell...
College Board
AP® Psychology: Teaching Statistics and Research Methodology
Psychologists use statistics? Scholars investigate the research behind the methodology of statistical analysis. Using hands-on practice, case-studies, and scatterplots, they complete various tasks to understand the very roots of high...
American Statistical Association
Don't Spill the Beans!
Become a bean counter. Pupils use a fun activity to design and execute an experiment to determine whether they can grab more beans with their dominant hand or non-dominant hand. They use the class data to create scatter plots and then...
American Statistical Association
How Long is 30 Seconds?
Is time on your side? Pupils come up with an experiment to test whether their classmates can guess how long it takes for 30 seconds to elapse. They divide the class data into two groups, create box-and-whisker plots, and analyze the...
Mathematics Vision Project
Module 9: Statistics
All disciplines use data! A seven-lesson unit teaches learners the basics of analyzing all types of data. The unit begins with a study of the shape of data displays and the analysis of a normal distribution. Later lessons discuss the...
Concord Consortium
Gestation and Longevity
Is the gestation length of an animal a predictor of the average life expectancy of that animal? Learners analyze similar data for more than 50 different animals. They choose a data display and draw conclusions from their graphs.


