Curated OER
This is the Way We Go To School
Second graders create and utilize a graph using the Excel computer program. They gather data regarding how the students get to school, tally the numbers for the class, and create a bar graph on paper and using Excel.
Curated OER
Look Into My Eyes!
Students explore collecting, analyzing, and graphing information. They collect data on the various eye colors of their classmates. Students tally the results and create a graph.
Curated OER
What's Up With My Class
Learners collect data about their class and they use Excel spreadsheet to display their tables and graphs about the class. They answer survey questions and collect their data. Students create a graph of their choice to display the...
Curated OER
Time Management
Young scholars record their daily activities and graph the results using the educational software program called Inspiration. This lesson is intended for the upper-elementary classroom and includes resource links and activity extensions.
Curated OER
Graphs of the OTHER Trig Functions
Students graph trigonometric functions. In this precalculus lesson, students identify the properties of secant ,cosecant and cotangent. They use the unit circle as their formula to graph and analyze these functions.
Curated OER
This is My Neighborhood
Students predict the things that they may see, smell, or hear in their neighborhood. They take part in a neighborhood walk, creating a rough map of their neighborhood as they go. Upon return to the classroom, students create a final map...
Curated OER
Data With Candy
Students, while utilizing the classroom and the computer lab with a bag of colored candy, gather and interpret data, calculate averages and draw conclusions and draw a bar graph. They estimate how many candies are in the bag, what...
Curated OER
Using Graphology to Teach Traditional Writing
Introduce your class to the narrative, descriptive and expository forms of writing. In groups, they discuss the personality of the author while graphing the characteristics after reading different examples from the same writer. To end...
Curated OER
Graphing the Population Explosion of Weeds
Students are introduced to the seed cycle and draw the specific steps. In groups, they identify the human barriers to the spreading of weeds. After calculating the rate of spreading of the Yellowstar Thistle, they create graphs to see a...
Curated OER
Jeopardy - Statistics
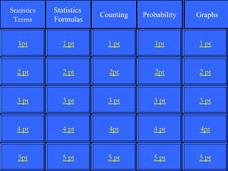
Jeopardy! " I would like Statistics Terms for 5 points Alex". Review, refresh, reinforce statistics terms and formulas for that upcoming quiz. Get your whole class involved by having them use individual whiteboards.
Curated OER
Tides at the Battery, NY
Skill in using Excel and increasing proficiency in manipulating data are challenged with this data analysis work. A web link supplies data and step-by-step instructions help learners create a graph. There are many extension activities...
Curated OER
Special Ed. Resource
Ways to organize data is the focus of this math PowerPoint. Students view slides that define and give descriptions of a variety of graphs, and how mean, median, and mode are found. A good visual tool which should benefit almost all types...
Curated OER
Application of Graph Theory
Students investigate different online tutorials as they study graphing. In this graphing lesson, students apply the concept of graphs cross curricular and use it to make predictions. They define the purpose and theories behind graphs.
Curated OER
Regents High School Examination: Mathematics B
In this algebra, graphing, and geometry exam instructional activity, 12th graders complete 34 math problems. The skills for each question cover a variety of topics, and graphing on grid paper is required for some of the questions.
Curated OER
The Mind-Body Connection
Second graders learn about the human body. In this biology lesson plan, 2nd graders will begin with the basics of understanding charts and graphs and progress into units that cover the body systems, and mental and emotional health....
Curated OER
Take Home Question – Chapter 4
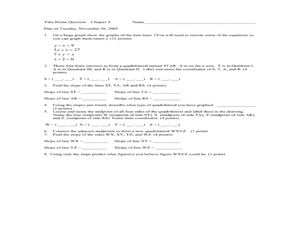
In this graphing linear equations worksheet, students solve 8 short answer and graphing problems. Students graph linear equations, find their points of intersection, find the slope of each line, identify the constructed quadrilateral, etc.
Math Mammoth
Mean, Median, and Mode One
In this mean, median, and mode learning exercise, students find the mean, median, and mode for different problems of money, weight, and more. Students complete 6 problems.
Curated OER
Geometry Exam
In this reflections and symmetry worksheet, students draw lines of symmetry in shapes and patterns and reflect letters over lines in graphs. Students complete 20 problems.
Curated OER
Math Regents Exam Questions - Pearson Integrated Algebra P.304: Histograms
In this histograms worksheet, students solve 9 short answer, multiple choice, and graphing problems. Students construct frequency tables and histograms of data.
Curated OER
Navajo Weaving
Learners explore the Navajo culture. In this Navajo Indians lesson, students gain information about their weaving and dancing. Learners note the patterns in the weaving. Students create a dance that corresponds with the patterns they see...
Curated OER
Gra[hing Linear Equations
In this Algebra I learning exercise, 9th graders use the slope and y-intercept to graph a linear equation and fill in a table with the coordinates of the five points plotted. The seven page learning exercise contains fourteen problems. ...
Curated OER
Compound Inequalities
In this algebra worksheet, students solve compound inequalities and graph their answer on a number line. There are 18 questions with an answer key.
Curated OER
Real Misleading Graphs
Students identify real graphs and misleading graphs. For this algebra lesson, students surf the Internet for real life scenarios where graphs are used in a misleading way as well as in a correct way.
Curated OER
Charts, Maps, and Graphs Lesson on the Holocaust
Students practice interpreting data. In this Holocaust lesson, students research selected Internet sources and examine charts, maps, and graphs regarding the Jewish populations in and out of Europe. Students respond to questions about...


