Curated OER
Math Regents Exam Questions: Graphing Rational Functions
In this graphing rational functions worksheet, students answer 18 multiple choice problems about rational functions. Students determine values for a which a function is undefined given the equation of the function.
Curated OER
Data Analysis: Infiltration Rate and Composition of Concrete
Students collect and graph data. In this statistics lesson, students analyze data using a spreadsheet program. They display their data effectively and analyze it.
Curated OER
Graphing Inequalities in One Variable
Students graph inequalities on a number line. In this algebra lesson plan, students solve linear and compound inequalities and graph them on a number line. They write an inequality given the number line with the solution on it.
Curated OER
Graphing Inequalities
Students solve inequalities and graph. In this algebra lesson, students rewrite inequalities in the slope intercept form and graph using the slope and intercept. They shade the correct side of the line using greater than or less than as...
Curated OER
Graphing Standard Form Inequality
Learners solve equations and graph it. In this algebra lesson plan, students solve inequalities and rewrite them in the slope intercept form. They graph the boundary lines first either as dashed or solid and shade the correct side of the...
Curated OER
Combining Functions
This worksheet includes 46 problems for students to solve. They must combine, solve, and graph functions, and use functions to evaluate and solve equations. This would be an excellent exam or pre test.
Curated OER
Linear and Quadratic Functions
In this algebra worksheet, 11th graders solve quadratic functions using the quadratic formula. They take the square roots of both side of each equation then graph both the linear and quadratic functions. There are a total of 84 problems...
Curated OER
Algebra I - Worksheet G12: Graphing Lines
In this graphing lines worksheet, students graph 28 lines given various data. Students graph lines given two points, a point and slope, and a line perpendicular or parallel to a point.
Curated OER
Graphing Race Results
Fifth graders graph bike mileage results. In this graphing information lesson plan, 5th graders get into groups, and organize the information they read. Students share how they organized the information with the rest of the class....
Curated OER
Worksheet Gr4: Linear Equations
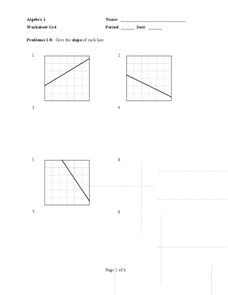
In this linear equations worksheet, students solve 24 short answer problems about slope. Students find the slope of a line given a table, graph, two points, and the intercepts.
Curated OER
Frequency Histograms, Bar Graphs and Tables
In this statistics worksheet, students graph their data using frequency histograms, bar graphs and tables. They decide which graph shows the data best. There are 6 graphing problems.
Curated OER
Info. From a Graph
In this graphing worksheet, students answer 13 questions about 3 graphs. Students determine the degree, roots, y-intercepts, inflection points, multiplicity, etc. of three different graphs.
Curated OER
Give Me A Break!
Students create and conduct a survey. In this broken bones lesson, students discuss if they've ever broken a bone and how a broken bone heals. Students generate questions for a survey on broken bones and healing time, conduct the survey...
Curated OER
Equation of a Straight Line Worksheet
In this equation of a straight line worksheet, students find the equation of 4 lines in slope intercept form. Students produce the linear equation of a line given its' graph.
Curated OER
Computation: How can we use rice to solve problem questions?
Fourth graders graph metric tons of rice produced by various countries. In this graphing instructional activity, 4th graders follow problem solving steps to answer questions about rice nutrition and then graph the amount of rice...
Curated OER
Consumer Confusion: Wants versus Needs and Gandhi's Wisdom
Fourth graders create graphs to illustrate consumer consumption throughout the world. In this consumer lesson plan, 4th graders also discuss wants and needs around the world, and consider Gandhi's opinion on material possessions as they...
Raytheon
Equations and Graphing Review
In this equations and graphing review instructional activity, learners write, graph and solve equations for 62 problems, including a mid-unit review, with answers included.
Curated OER
Reading and Sketching Graphs
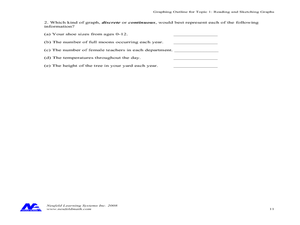
In this graphs worksheet, students answer 15 multistep questions about graphs. Students determine distance traveled, time, velocity, and create scenarios to fit the graph.
Raytheon
Data Analysis and Interpretation
For this data analysis and interpretation worksheet, learners use charts, graphs, statistics to solve 42 pages of problems with answer key included.
Curated OER
Cost Calculations Lesson Plan
Students analyze data using graphs and equations. In this algebra instructional activity, students calculate the cost of lumber, convert price per foot to price per piece, solve equations using addition and subtraction and give exact...
Raytheon
Graphing: Slope
For this slope learning exercise, students complete problems having to do with slope including adding integers, graphing, finding ordered pairs, and more. Students complete 55 problems.
Raytheon
Scatter Plots
In this scatter plots worksheet, middle schoolers complete multiple choice questions about scatter plots having to do with money, free throws, exercising, and more. Students complete 8 problems.
Curated OER
Three for the Money: The Degree/Diameter Problem
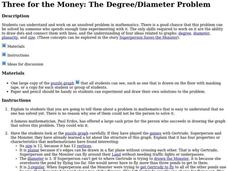
Students explore the degree, diameter, planarity, and size of graphs. In this degree, diameter, planarity, and size of graphs lesson, students try to construct a graph with more than 12 vertices that satisfy all other requirements. ...
Curated OER
Eat Your Veggies
Students investigate displaying data. In this displaying data lesson, students use tallies to count data about food preferences. Students use various types of graphs such as bar graphs, picture graphs, box-and-whisker plots, etc to...


