Curated OER
EXCEL It!
Learners surf the Web gathering information about graphs. The data collected is incorporated into an Excel spreadsheet and graphs of varying nature generated to further enhance student understanding.
Curated OER
Determining the Number of Wavelengths
After displaying three diagrams showing 1, 1 1/2, and 2 wavelengths, the slide show presents more diagrams and expects pupils to determine the number of wavelengths in each. No labels or explanations are provided, so this would be useful...
Curated OER
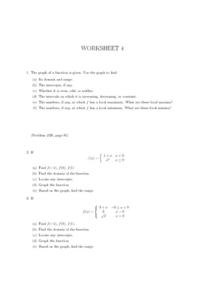
Worksheet 4, Functions
Eighth and ninth graders graph a given function and identify the domain, range and intercepts. Theytell the intervals that the function is increasing, decreasing, or constant. Pupils identify the minimum and maximum of the graph, and...
Curated OER
Hopes and Dreams: A Spreadsheet Lesson Using Excel
Fourth graders read "The Far Away Drawer" by Harriet Diller and discuss the story as a class. After discussion, 4th graders create a t-shirt GLYPH about their hopes and dreams,share their information with the class and create spreadsheets.
Curated OER
Using M&M's to Teach Bar Graphs
Motivate your class with this lesson. While not fully fleshed out, this activity is meant to be used as an introduction to the use of bar graphs. Learners sort M&M's and create bar graphs to display their information.
Curated OER
Probability and Statistics
Students are taught to search the internet for statistics concepts on sports. In this probability lesson, students collect data and use the calculator to graph and analyze their data. They graph and make predictions about sports using...
Curated OER
Trigonometry Review
In this trigonometry instructional activity, students solve trigonometric equations, prove trigonometric identities, and graph trigonometric functions. The four page instructional activity contains sixteen questions. Answers are not...
Curated OER
Math Honors 2: Trigonometry Review Questions
In this Algebra II/Trigonometry worksheet, students solve problems involving angle of depression or elevation, evaluate trigonometric expressions, solve trigonometric equations, and graph trigonometric functions. The one page worksheet...
Curated OER
Graphs
In this graphs worksheet, students use data form a tally chart to complete a graph of favorite seasons. A website reference for additional resources is given.
Curated OER
Graphing Activity
In this graphing activity, students use data from a tally chart to complete a graph of favorite subjects and answer 4 related questions. A website reference for additional resources is given.
Curated OER
Graphing #4
In this graphing worksheet, students use data from a tally chart to create a graph of favorite sports and answer 4 related questions. A website reference for additional resources is given.
Curated OER
Graphs #3
In this graphing worksheet, students use tally marks to create a pictograph of lemonade sold each day. A website reference for additional resources is given.
Curated OER
Graphing Activity #3
In this graph worksheet, learners use information in a tally chart to complete a pictograph of favorite pizza toppings and answer 4 related questions. A website reference for additional resources is given.
Curated OER
Graphing Trash Material
Students investigate data and recyclable materials. In this math lesson, students save recyclable materials and create a graph of the materials. Students discuss how they could help the environment by recycling.
Curated OER
Making Graphs
Students explore statistics by conducting class demographic surveys. In this graph making activity, students identify the family members of each classmate, pets they own, and favorite activities. Students organize their statistics and...
Curated OER
Quadratic Applications
In this quadratic applications worksheet, students complete graphs, charts, comparison charts, and more having to do with quadratic equations. Students complete 5 different activities.
Curated OER
Analyzing Non-Fiction Text Features- Graphs
Students examine the text features of non-fiction. For this literacy lesson, students practice reading graphs and discover the authors intent for using them in primary and secondary sources.
Curated OER
Analyzing Nonfiction Text Features - Graphs
Students examine the text features of non-fiction. In this literacy lesson plan, students practice reading graphs and discover the authors intent for using them in primary and secondary sources.
Curated OER
Impact!!
Students perform a science experiment. In this algebra lesson, students collect data from their experiment and create a graph. They analyze the graph and draw conclusion.
Curated OER
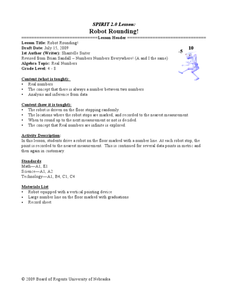
Robot Rounding!
Students collect data on a robot and relate the behavior to prove there is an infinite minute set of numbers. In this algebra lesson, students verify that there is always a number between two numbers. They analyze and make inference from...
Curated OER
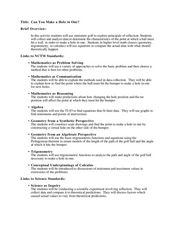
Can You Make a Hole in One?
Students relate miniature golf to reflection of an image. In this algebra lesson, students collect and graph data as they study linear equations. They apply properties of graphing to solve real life scenarios.
Curated OER
Does Music Cam the Savage Beast?
Students collect, graph and analyze data. For this statistics lesson, students measure the heart beat of a person as they listen to music. They use the CBL and TI to create a graph, analyzing the outcome.
Curated OER
Walking on Air
Pupils collect and analyze data with a graph. In this statistics instructional activity, students use central tendencies to find the meaning of their data. They display the data on a Ti calculator.
Curated OER
Let's Go Slopey
Students create a table of values to graph a line. In this algebra instructional activity, students identify the slope and intercept of a linear equation. They use a Ticalculator to graph their function.


