Curated OER
How High Are the Clouds?
Learners analyze height and collect data to create a graph. In this statistics lesson, students use central tendencies to analyze their data and make predictions. They apply concept of statistics to other areas of academics to make a...
Curated OER
Graphing Data Brings Understanding
Students collect, graph and analyze data. In this statistics lesson, students use circle, pie, bar and lines to represent data. They analyze the data and make predictions bases on the scatter plots created.
Curated OER
CEEnBoT Stories
Students identify the slope of a line as negative, positive, zero or undefined. In this algebra lesson, students identify the distance versus the time using graphs of linear equation. They use the robot and the CEENBoT program to analyze...
Curated OER
A Thanksgiving Survey
Students conduct a survey. In this math lesson, students design and conduct a survey about Thanksgiving foods. Students display the collected data in a graph and use the graph to determine what food to serve for a Thanksgiving meal.
Curated OER
Average
In this averages worksheet, students complete word problems about the averages about grocery bills, hospital stays, graphs, and more. Students complete 10 problems.
Curated OER
Graphs
In this graphs learning exercise, students complete word problems about a bar graph of tickets sold for the drama club. Students complete 8 problems.
Curated OER
Data and Graphs
In this data and graphs activity, students complete multiple choice questions about which bar graphs represent the data given and complete a bar graph based on data given. Students complete 3 problems.
Curated OER
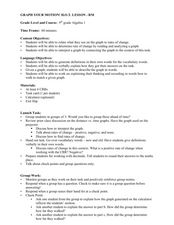
Graph Your Motion
Students graph their linear equations. In this algebra instructional activity, students examine their lines and relate it to the slope or rate of change. They relate the steepness of the line to the slope being positive, negative or zero.
Curated OER
Quadratic-Linear Systems 2: Solve Systems of Equations Involving One Linear Equation and One Quadratic Equation Algebraically
In this solving systems of quadratic and linear equations, students complete three problems. The first problem asks students to solve a system of two equations. One of the equations is a quadratic and the other is linear. The second two...
Curated OER
And Now…the Supply Curve!
In this economics learning exercise, students use their problem solving skills to respond to questions regarding the supply curve and its impact on an individual's lemonade stand business.
Curated OER
Boxplots Introduction
Students describe the pattern of a bell curve graph. In this statistics lesson, students move data around and make observation about the mean, and the quartiles. They define boxplot, outlier, range and other important vocabulary words...
Curated OER
Graphing Linear Equations
Students graph linear equations. In this algebra lesson, students perform transformation on linear equations. They identify the slope and y-intercept of each line.
Curated OER
Race Track (Culminating Activity)
Students graph and solve linear equations. In this algebra lesson, students use the slope and y-intercept to graph lines. They relate lines to the real world using different applications.
Curated OER
Coordinate Geometry
In this Algebra I instructional activity, 9th graders identify and graph points on a coordinate plane, determine the x-and y-intercepts of a linear equation, and graph linear equations. The six page instructional activity contains...
Curated OER
Graphing Linear Equations with Calculator
Students graph lines using the calculator. In this algebra lesson, students graph lines of equations in the form y=mx+b. They input equations into the TI Calculator and graph using the slope and intercept. They analyze the graph for...
Curated OER
Constant Dimensions
Middle schoolers explore measuring units by investigating the dimensions of different objects. In this data graphing lesson, students utilize candy, beads and fingers to measure different dimensions of geographic figures. Middle...
Curated OER
Graphs
Eighth graders analyze graphs on a worksheet and in newspapers and magazines. In this graphs lesson plan, 8th graders also record their thoughts in a journal.
Curated OER
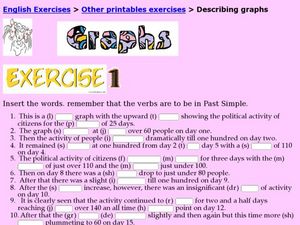
Describing Graphs
In this graphs worksheet, students fill in the blanks to sentences to describe graphs. Students complete 19 sentences total on this worksheet.
Curated OER
Graph Vocabulary
For this graph vocabulary interactive worksheet, students enter the appropriate graph words using the first letters as clues to the words. They look at a graph for clues and use verbs that are in the past simple. They complete 21...
Curated OER
Every Graph Tells A Story
Seventh graders explore linear equations. In this graphing lesson, 7th graders explore constant rates of change. Students discover the real-life application of graphs and demonstrate their ability to read graphs and write corresponding...
Curated OER
Earthquake on the Playground
Learners investigate earthquakes by examining chart data. In this disasters instructional activity, students identify the waves that are recorded when an earthquake arises by reading sample graphs in class. Learners participate in an...
Curated OER
Graphing Linear Equations
Eighth graders examine linear equations by creating graphs from them. In this graphing lesson, 8th graders read several linear equations and plot them on a graph with the help of their classmates. Students find the slope of the linear...
Curated OER
Make a Line Graph
In this make a line graph learning exercise, 6th graders make a line graph for 2 sets of data, using a blank grid, by plotting the numbers, labeling the x and y axes and writing a title.
Curated OER
Shapes Graphing
In this graphing data worksheet, students examine the 11 shapes pictured and use that information to finish an incomplete bar graph.


