Teachnology
Teachnology: Math Lesson Plans
Great lesson plans covering a wide-range of math-related subjects.
That Quiz
That Quiz: Practice Test: Graphs
This resource allows users to test their knowledge of graphs and graphing methods.
National Council of Teachers of Mathematics
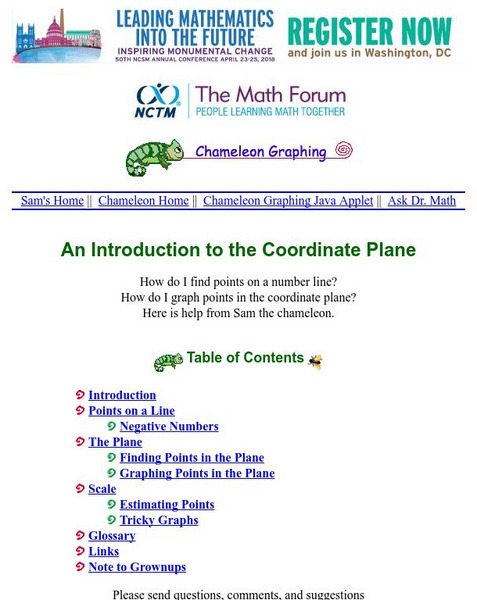
The Math Forum: Chameleon Graphing: Coordinate Plane
Dive into this introduction to graphing in the coordinate plane, and meet a chameleon named Sam. Sam will help guide you through graphing points on a line, using negative numbers, and graphing points in the coordinate plane.
Center for Innovation in Engineering and Science Education, Stevens Institute of Technology
Ciese Real Time Data Projects: Weather Scope: A Study of Weather and Climate
Use real-time data to study factors that affect weather and climate, create weather instruments, and share data with students around the world.
TeachEngineering
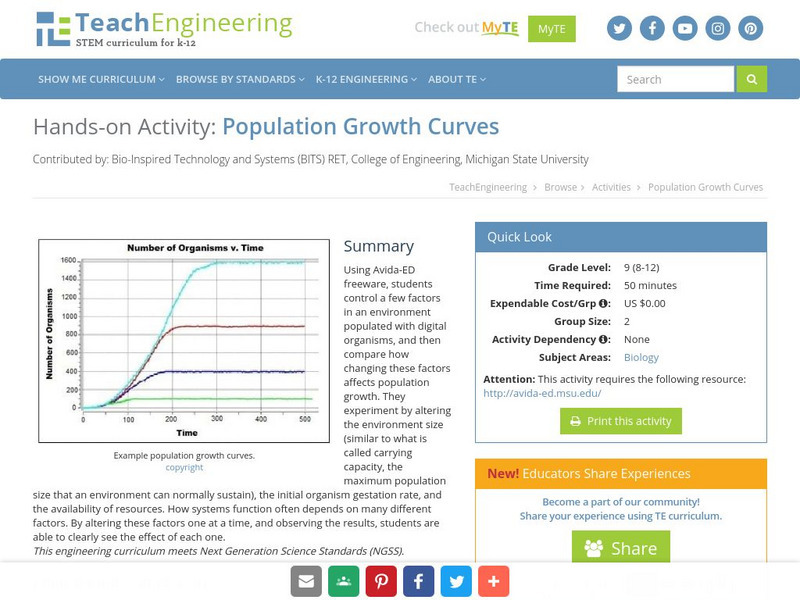
Teach Engineering: Population Growth Curves
Using Avida-ED freeware, students control a few factors in an environment populated with digital organisms, and then compare how changing these factors affects population growth. They experiment by altering the environment size (similar...
Northeast Parallel Architectures Center, Syracuse University
Npac Reu Program: Slope & Line Equations
This site from the Northeast Parallel Architectures Center, Syracuse University has a very substantial discussion of math topics slope & line equations. The outline form is quite useful if you need to zero in on one aspect of...
National Council of Teachers of Mathematics
The Math Forum: Lines and Slope: Chameleon Graphing
Join Joan the chameleon in an exploration of lines and slope. You'll be drawing lines, calculating slope, using equations and more!
Education Development Center
Math Partners: Statistics and Probability [Pdf]
Comprehensive unit that consists of lessons and activities designed to help students learn statistics and probability concepts.
Center for Innovation in Engineering and Science Education, Stevens Institute of Technology
Ciese Collaborative Projects: Down the Drain: How Much Water Do You Use?
How much water do you use everyday? Find out in this engaging investigation, where you compare your water usage with your classmates and other people around the world. An exploration filled with lots of math and science that students are...
Savvas Learning
Prentice Hall Science & Math: Graphing Calculator Help
This site provides very complete help guides for a variety of graphing calculator models, complete with pictures and step-by-step instructions.
Rice University
Rice University: Cynthia Lanius: Fun Mathematics Lessons
This resource has mathematics lessons for different levels, from counting to slope. In English and Spanish.
National Council of Teachers of Mathematics
Nctm: Illuminations: Axonometry: Applying Complex Numbers to Art
Axonometry is an illumination that has students discover relationships between complex numbers and graphing. Students make connections between algebraic and graphical representations of a complex number.
Concord Consortium
Concord Consortium: Smartgraphs: Equivalent Graphs
Students investigate graphs that are equivalent, in the sense that they represent the same data, though they look different because they employ different scales.
Concord Consortium
Concord Consortium: Smartgraphs: Graphs Tell a Story
Students match a word story to the correct set of graphs involving temperature change over time.
BSCS Science Learning
Bscs: Global Night Sky Comparison
This inquiry invites students to investigate human impacts on the environment. Specifically, students will examine the relationship between human population, light pollution, and how brightly celestial objects like stars appear in the...
BSCS Science Learning
Bscs: Frog Eat Frog World
Using maps and graphs of large data sets collected in FrogWatch, students will determine the range, preferred land cover, and proximity to water of the American bullfrog to figure out the bullfrog's requirements for food, water, and...
Other
Bscs: Restoring Oyster Reefs
In this self-directed lesson plan, students use data from the Chesapeake Bay estuary to determine suitable sites for oyster reef restoration. A handout with everything the student needs to complete this lesson plan is available as a PDF...
Other
Bscs: Frog Symphony
For this self-directed lesson, students use maps and graphs of data to investigate the habitats and time of year and day to hear a full chorus of frogs. A handout with everything the student needs to complete this lesson is available as...
PBS
Pbs Learning Media: Everyday Learning
Learning does not take place only in the classroom. Learning occurs naturally, every day! This KET collection uses original animation and wonderful, visual images to introduce basic concepts of math, science, social studies, art, and...
Concord Consortium
Seeing Math: Linear Transformer
Transformations of linear functions, with links between the symbolic and graphic forms, can be powerful tools to help students overcome conceptual hurdles in algebra.
Cyberbee
Adventures of Cyberbee: Graphing
Teacher-directed lesson plan focusing on data analysis, graphing, and probability. Lesson includes a video and engaging spreadsheet activities.
University of Illinois
University of Illinois: Line Graphs
Line graphs are shown and explained here. You can learn what kind of data is best represented using a line graph. There are also line graphs with questions and answers available to help you learn how to read them.
Richland Community College
Richland Com. College: Graphing Systems of Inequalities
Thyis site offers problem solving systems and graphing systems of inequalities. Illustrations included.
US Department of Education
Nces: Create a Graph: Kids Zone
Make your own pie, bar, line, area or XY graph with this interactive tool. Look for examples of graphs already created from data collected by the National Center for Education Statistics. Complete with a graphing tutorial.


![Math Partners: Statistics and Probability [Pdf] Unit Plan Math Partners: Statistics and Probability [Pdf] Unit Plan](https://d15y2dacu3jp90.cloudfront.net/images/attachment_defaults/resource/large/FPO-knovation.png)


