Texas Instruments
Texas Instruments: Variety Is the Spice of Life
In this activity, students will collect data on all members of the class. They will make a graph of the data collected, interpret variations, and then draw conclusions.
Texas Instruments
Texas Instruments: How Fast Are You?
Use the Data/Graphs Wizard tool in the SciTools App to compare the averages of four sets of data.
Texas Instruments
Texas Instruments: Connecting Factors and Zeros
Students will determine if a quadratic formula is factorable, then they will factor the equation, set each factor equal to 0, and solve for x.
Science Education Resource Center at Carleton College
Serc: Cycles of the Sun and Moon
Students download sunrise and sunset data along with moon phase data, and graph these data sets together in a spreadsheet in order to visualize the cycles of the seasons and the moon.
Northeast Parallel Architectures Center, Syracuse University
Npac Reu Program: Functions and Graphs
This site from the Northeast Parallel Architectures Center, Syracuse University contains a college level treatment of functions and graphs. Function, element, domain, range, piece-wise functions?? Stuff you know, stuff that's new. Very...
Texas A&M University
Wtamu Virtual Math Lab: College Algebra: Equations of Lines
This tutorial covers x & y intercepts, point-slope form, slope-intercept form, graphing, and more. Use the practice problems at the end to check your skills.
SRI International
Performance Assessment Links in Science: Discovering the Problem of Solid Waste
This activity has students sort garbage, graph their results and propose ways of reducing waste.
Oswego City School District
Regents Exam Prep Center: Multiple Choice Practice: Probability
Test your knowledge of probability by taking this twenty question multiple-choice practice test. Use a graphing calculator to help with any graphing problems and check your answers at any given time throughout the test.
University of Colorado
University of Colorado: Ph Et Interactive Simulations: Graphing Slope Intercept
An interactive simulation that teaches about slope-intercept form and graphing linear equations through observations while connecting the slope and y-intercept to the line equations. This simulation can either be downloaded or played...
PBS
Pbs Lesson Plan: Chances Are Talking Probability (Pdf) [Pdf]
An introductory lesson in probability for students in grades three to five. The concepts presented in this lesson are interwoven, over time, into a current unit of study. Students examine closely the "language" of probability as used in...
PBS
Pbs Mathline: Bubble Mania [Pdf]
Bubble Mania is a lesson plan that focuses on the concept of measurement as it applies to the diameter, circumference, and area in a bubble. Extension activities and connections, related worksheets, and additional resources are included.
PBS
Pbs Mathline Lesson Plan: Struts'n Stuff [Pdf]
Incorporating concepts in algebra, number sense, patterning, data collection, and geometry, this lesson plan engages students in various hands-on activities to explore the relationship between regular polygons and the number of diagonals...
PBS
Pbs Mathline: Sand Babies (Pdf) [Pdf]
In this engaging lesson, students use a variety of measurement strategies in creating their own Sand Babies. Students explore standard and non-standard measurements, area, data collection and analysis, and graphing. Adaptations are...
PBS
Pbs Teachers: Madagascar: Leaping Lemurs
For this lesson, students use the activity of measuring their jumping distances to develop measurement and graphing skills. Although this activity is meant to be completed in conjunction with watching the PBS program, "Madagascar: A...
California State University
Ca State University, San Bernadino: Graphing Techniques
A survey of math graphing techniques includes horizontal and vertical shifts, stretching, lines of symmetry, even and odd functions, and absolute value functions.
Other
Georgia Perimeter College: Graphing Quadratic Inequalities
This resource shows students how to graph quadratic inequalities, and gives assistance with using a graphing calculator.
Other
Georgia Perimeter College: Parabolas
This resource provides an examination of parabolas, both vertical and horizontal, and parabolic functions. It includes six examples and a chart showing how changes in the equation coincide with changes in the graph.
Other
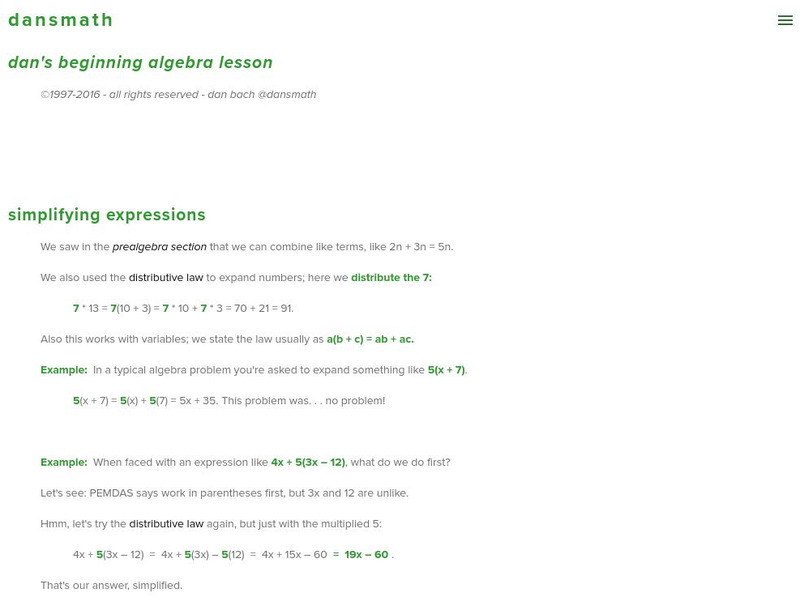
Dans Math: Lessons: Beginning Algebra
College professor Dan Bach offers a review of basic algebra concepts complete with definitions, explanations, and examples. Topics include simplifying expressions, solving linear equations, and graphing.
PBS
Pbs Teachers: Tree Mendous Plots [Pdf]
To teach students how to use collect and use real-life data, use this lesson to create, populate and analyze graphs to interpret data related to the growth of plants from seeds. The lesson then asks students to create a story about the...
The Franklin Institute
Frankin Institute Online: Group Graphing
This site from The Franklin Institute explores how to make a simple graph using a spreadsheet to portray survey data. It also gives a set of interesting sports-related web sites so that students can get statistical inforamtion.
Other
Linear Functions, Slope and Regressions
Find activities here for linear functions, slopes and regression lines. Use them for classroom work or individual assignments.
ABCya
Ab Cya: Fuzz Bugs Graphing
Students drag the fuzz bugs into the correct container to create a bar graph that is used to compare data.
Other
Dans Math: Lessons: Intermediate Algebra
College professor Dan Bach presents a review of algebra concepts, including factoring, quadratic equations, and graphing parabolas. The examples are detailed, but easy to follow. This is a good site for reviewing before tests and quizzes.




![Pbs Lesson Plan: Chances Are Talking Probability (Pdf) [Pdf] Unknown Type Pbs Lesson Plan: Chances Are Talking Probability (Pdf) [Pdf] Unknown Type](https://d15y2dacu3jp90.cloudfront.net/images/attachment_defaults/resource/large/FPO-knovation.png)

![Pbs Teachers: Tree Mendous Plots [Pdf] Lesson Plan Pbs Teachers: Tree Mendous Plots [Pdf] Lesson Plan](https://content.lessonplanet.com/knovation/original/114247-36948766618258b08210c17f84fd1d88.jpg?1661419217)
