Utah Education Network
Uen: Chicken Pox Math
Students will engage in a shared reading of Itchy, Itchy Chicken Pox by Grace Maccarone, Arthur's Chicken Pox by Marc Brown, or Turkey Pox by Laurie Anderson. Students will discuss the text and then engage in several math-related tasks...
Can Teach
Can Teach: Plot Four: Positive and Negative Numbers
Plotting points is usually an interesting activity for learners. Make it even more interesting and engaging using this game.
Khan Academy
Khan Academy: Interpreting Graphs of Proportional Relationships
Practice reading and analyzing graphs of proportional relationships. Students receive immediate feedback and have the opportunity to try questions repeatedly, watch a video or receive hints.
Teachnology
Teachnology: Spreadsheet Guide for Teachers
A Spreadsheet is a wonderful tool with applications well beyond simple calculations. This site provides a collection of lesson plans, tutorials and worksheets that help bring spreadsheets into the classroom.
CK-12 Foundation
Ck 12: Algebra: Graphs in the Coordinate Plane
[Free Registration/Login may be required to access all resource tools.] Students learn to graph points and functions in the coordinate plane. Students examine guided notes, review guided practice, watch instructional videos and attempt...
Sophia Learning
Sophia: Lio + Lola: Graphing Rational Functions
Graph rational functions using examples and step by step guide.
Sophia Learning
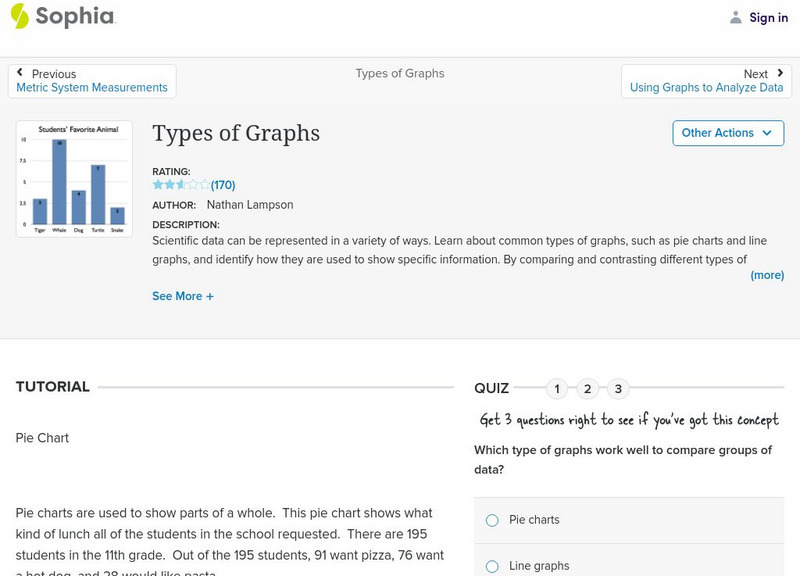
Sophia: Types of Graphs
This presentation allows the learner to visualize the different types of graphs used to display data in scientific investigations.
Northeast Parallel Architectures Center, Syracuse University
Npac Reu Program: Graphing With Coordinates in the Plane
This site from the Northeast Parallel Architectures Center, Syracuse University provides a good five-part basic graphing instructor. Covers all the basics clearly. It is divided into links for easier navigation.
Khan Academy
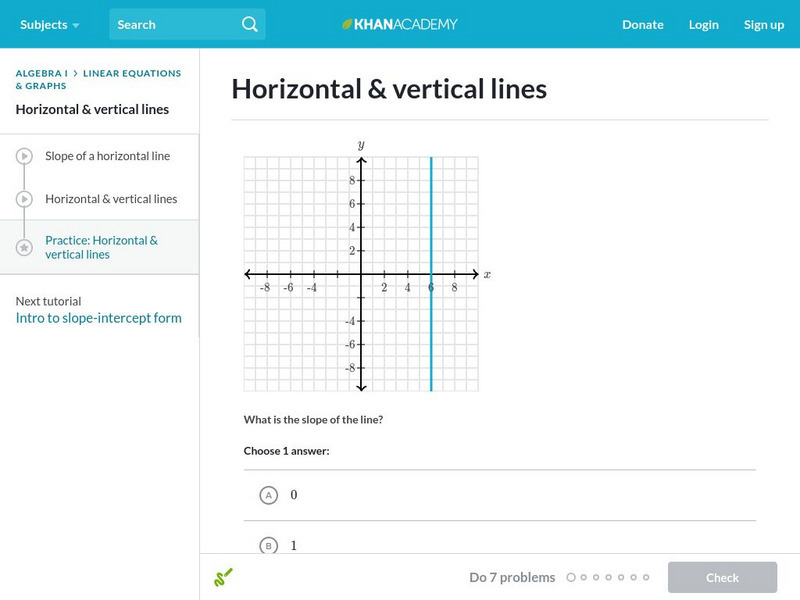
Khan Academy: Horizontal & Vertical Lines
Practice your knowledge of horizontal and vertical lines: their graphical presentation, their slopes, and their equations. Students receive immediate feedback and have the opportunity to try questions repeatedly, watch a video or receive...
Khan Academy
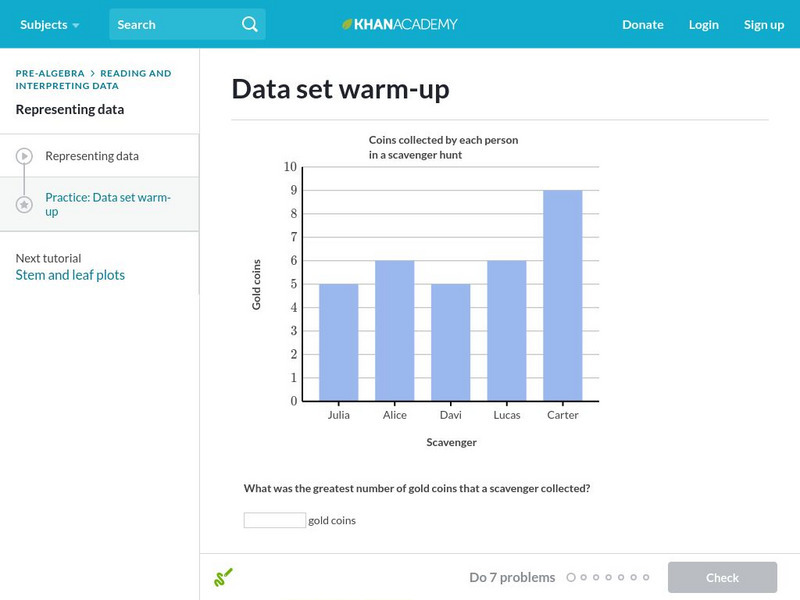
Khan Academy: Data Set Warm Up
Begin your journey into the world of statistics with some warm-up questions about data sets. Students receive immediate feedback and have the opportunity to try questions repeatedly, watch a video or receive hints.
National Council of Teachers of Mathematics
The Math Forum: Graphing Linear Functions
Use this guide to practice graphing linear functions using Claris Works with your students. The lesson walks you through the process of setting up Claris Works step-by-step.
McGraw Hill
Glencoe Mathematics Online: Study Tools: Graphing Linear Inequalities
This site gives a short interactive quiz which allows students to self-assess their understanding of the concept of graphing linear inequalities.
Sophia Learning
Sophia: Graphing in Science
Students will learn how to use appropriate and different procedures, tools, measurements, graphs and mathematical analyses to describe and investigate natural and designed systems in a physical science context.
Purple Math
Purplemath: Solving One Step Linear Equations
Demonstrates step-by-step, with illustrations, how to solve linear equations. Also explains the formatting and reasoning for 'no solution' and 'all x' equations. Includes interactive tool for practice solving linear equations.
Purple Math
Purplemath: X and Y Intercepts
This lesson from Purplemath.com explains how to find x and y intercepts then shows exmples.
Purple Math
Purplemath: Algebra Resources
Purplemath contains about 40 different lessons on various algebra topics. The lessons are divided into five different sections: preliminary topics, beginning algebra, intermediate algebra, advanced algebra, and word problems. The lessons...
Math Planet
Math Planet: Linear Equations in the Coordinate Plane
Gain an understanding of linear equations in the coordinate plane by viewing examples and a video lesson. [2:56]
Physics Aviary
Physics Aviary: Data Generator for Learning to Graph
A program that will randomly generate data the students can then graph and curve fit. Gives students a chance to learn Logger Pro or other graphing program before starting actual labs.
Cool Math
Coolmath: Pre Calculus Graphs to Know and Love
A list and visuals of standard graphs from y = x to an absolute value.
Cool Math
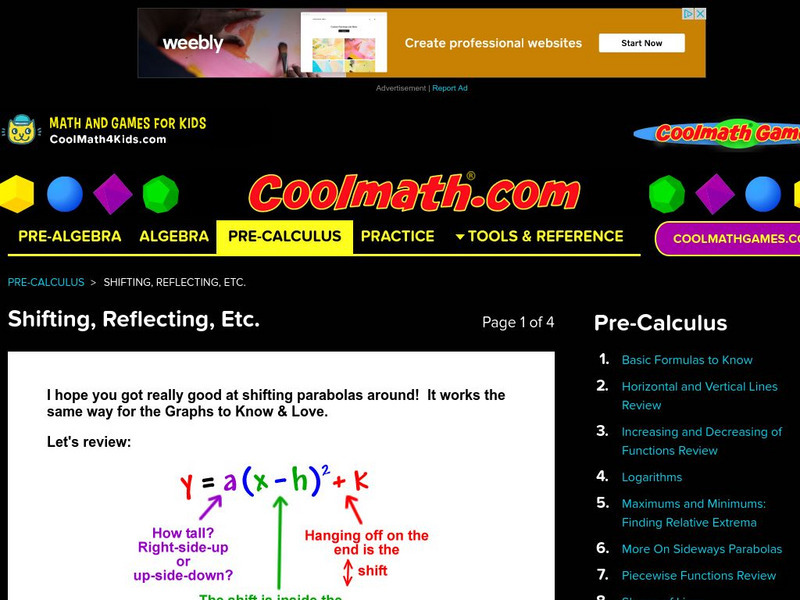
Coolmath: Pre Calculus Shifting, Reflecting, Etc.
Description and examples of shifting and reflecting various graphs.
Illustrative Mathematics
Illustrative Mathematics: 6.sp4, 5c Puzzle Times
A performance task asking students to create a graph of provided information and then find the mean and the median of the data.
Illustrative Mathematics
Illustrative Mathematics: 6.sp Puppy Weights
A performance task asking students to create a graph of provided information and then answer two questions about the information provided with that graph.
Texas Education Agency
Texas Gateway: Analyze Graphical Sources: Practice 2 (English I Reading)
You will look at each of these types of graphs: bar graph, line graph, pie charts, as you work your way through the lesson.
Khan Academy
Khan Academy: Plotting Inequalities
Create number line graphs of inequalities. Students receive immediate feedback and have the opportunity to try questions repeatedly, watch a video or receive hints.


