Better Lesson
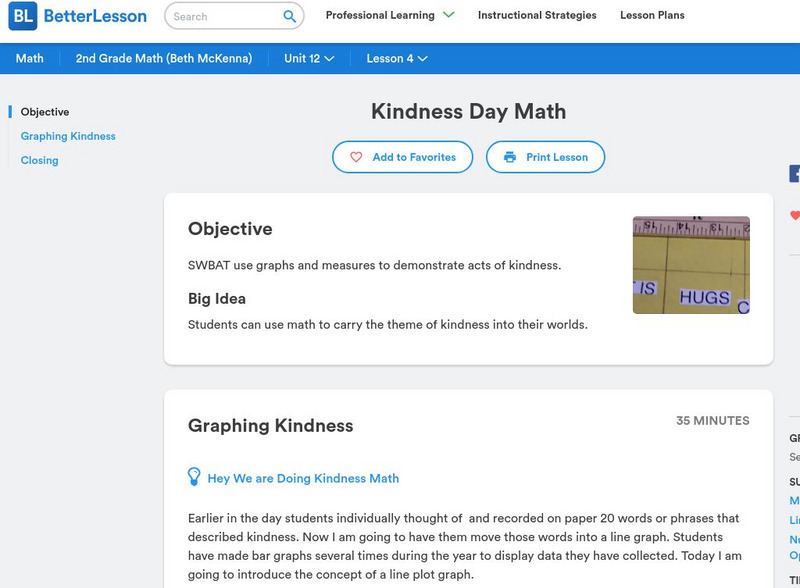
Better Lesson: Kindness Day Math
Second graders can use graphs to carry the theme of kindness into their worlds.
National Council of Teachers of Mathematics
Nctm: Illuminations: Line of Best Fit
Use this activity to practice how to enter a set of data, plot the data on a coordinate grid, and determine the equation for a line of best fit.
Shodor Education Foundation
Shodor Interactivate: Vertical Line Test
Learn about the vertical line test for functions by trying to connect points in the plane to build a function. When you have connected all of the points, you will be told if your graph is a valid graph of a function.
Shodor Education Foundation
Shodor Interactivate: Histogram
View histograms for built-in or user-specified data. Experiment with how the size of the class intervals influences the appearance of the histogram.
Math Open Reference
Math Open Reference: Coordinate Plane
Learn about the coordinate plane with this reference guide. Provides detailed definitions, examples, and an interactive activity that enhances further explanation.
Shodor Education Foundation
Shodor Interactivate: Simple Coordinates Game
Investigate the first quadrant of the Cartesian coordinate system through identifying the coordinates of randomly generated points, or requesting that a particular point be plotted.
Shodor Education Foundation
Shodor Interactivate: General Coordinates Game
Investigate the Cartesian coordinate system through identifying the coordinates of a randomly generated point, or requesting that a particular point be plotted.
Shodor Education Foundation
Shodor Interactivate: Polar Coordinates
This activity allows the user to explore the polar coordinate system. The applet is similar to GraphIt, but instead allows users to explore the representation of a function in the polar coordinate system.
Shodor Education Foundation
Shodor Interactivate: Data Flyer
Enter a set of data points, then derive a function to fit those points. Manipulate the function on a coordinate plane using slider bars. Learn how each constant and coefficient affects the resulting graph.
Concord Consortium
Concord Consortium: Smartgraphs: Independent and Dependent Variables
For various scenarios students select which of two variables should be considered independent and which dependent, and to explain their choice.
Concord Consortium
Concord Consortium: Growing Up
Demonstrate your understanding of linear growth graphs.
CK-12 Foundation
Ck 12: 3.3 Inverse Functions
This section explores the process for finding inverses of functions, and then proving the function and its inverse algebraically. Additionally, it explores how the graphs of functions and their inverses compare to each other, and it...
Quia
Ixl Learning: Slope Intercept Form
Brush up on your math skills relating to slope-intercept form then try some practice problems to test your understanding.
PBS
Pbs: Using the Pythagorean Theorem on the Cartesian Graph
In this interactive, students use logic and mathematical skill to place animals at the correct points on a Cartesian graph representing the cardinal directions. Then, they use the Pythagorean theorem to determine the distances between...
BSCS Science Learning
Bscs: Invitations to Inquiry With Data Using Field Scope
Invitations to Inquiry are short instructional activities designed to help middle and high school students work with large data sets. Teachers and students use the interactive FieldScope platform to collect, visualize, and analyze...
Other
Nearpod: Pairs of Linear Equations
In this lesson plan, 8th graders will learn how to solve systems of equations by graphing, substitution, and elimination.
Other
Nearpod: Systems of Equations & Solutions
In this instructional activity on systems of equations, 8th graders will learn how to solve systems by graphing and examine graphs to determine if a system has one solution, infinite solutions, or no solution.
Other
Nearpod: Interpreting Slope & Y Intercept
For this lesson on interpreting slope and y-intercept, 8th graders will learn how to identify the slope and the y-intercept of a line in order to identify if a proportion is demonstrated.
Other
Nearpod: Distance Time Graphs
In this lesson on distance-time graphs, students will understand graphing by analyzing distance-time graphs.
Other
Nearpod: Quadratic Equations: Completing the Square
In this instructional activity on completing the square, students explore the connection between area models and perfect square trinomials. They also learn how to complete the square to transform a quadratic equation into vertex form.
Other
Nearpod: Inequalities in One Variable
In this lesson, 7th graders will learn how to write and graph inequalities to represent real-life situations.
E-learning for Kids
E Learning for Kids: Math: Wizards: Graphs
Join the Magic Wandia Games and learn all about graphs!
E-learning for Kids
E Learning for Kids: Math: Traditional African Village: Data
Students will play interactive games to strengthen their skills of sector graphs.
George Mason University
Handmade Manipulative Instructions
At this personal site, you will find pages of math manipulatives and different types of graphing paper to print out and use in your classroom.


